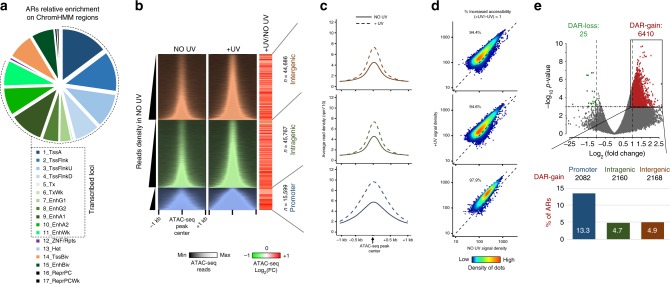
Fig. 1. Increase in chromatin accessibility in response to mild doses of UV irradiation.
a Classification of ARs according to ChromHMM annotation. The dashed line represents active regulatory loci. b (Left panel) Heatmap of ATAC-seq reads in genomic regions 1 kb around ATAC-seq peak centers before (NO UV) and after UV (+UV, +2 h; 15 J/m2), categorized according to their genomic position relative to RefSeq genes (intergenic, intragenic, and promoter peaks) and sorted by increasing read density (as determined before UV). (Right panel) Heatmap showing the log2 fold change (log2 FC) between +UV and ΝΟ UV read densities calculated in genomic regions 1 kb around ATAC-seq peak centers. c Average profile plots of ATAC-seq read densities of non-irradiated (solid line) and irradiated (dashed line) cells in intergenic (red), intragenic (green), and promoter (blue) regions. d Heat-density scatter plots comparing ATAC-seq read density before and after UV at all accessible regions (ARs) in intergenic, intragenic, and promoter regions, respectively. e (Upper panel) Volcano plot representing differentially accessible regions (DARs) between irradiated and non-irradiated cells. Regions with significantly increased (DAR-gain) or decreased (DAR-loss) accessibility are depicted in red and green, respectively. (Bottom panel) Proportion of DAR-gain loci in intergenic, intragenic, and promoter ARs.

