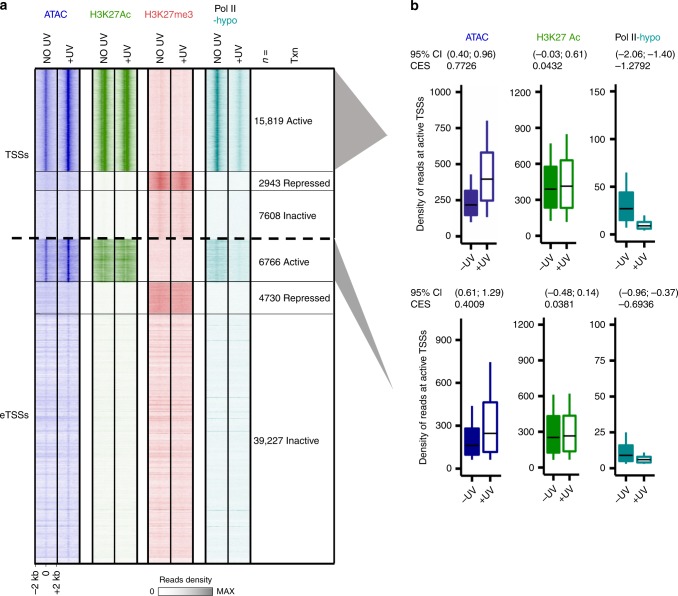
Fig. 2. Histone modifications remain virtually stable upon UV damage.
a Heatmap depicting read densities for ATAC-seq, H3K27ac, H3K27me3, and Pol II-hypo ChIP-seq before (NO UV) and at 2 h post UV (+UV: ATAC and H3K27ac: 15 J/m2, H3K27me3: 20 J/m2), for genomic regions 2 kb around active, inactive, and repressed TSSs and eTSSs, respectively. Data for Pol II-hypo are obtained from ref. 25 (at 1.5 h post UV with 8 J/m2, see “Methods” for details). b Boxplots summarizing quantifications of ChIP-seq reads shown for active TSSs and eTSSs, respectively. Boxplots show the 25th–75th percentiles, and error bars depict data range to the larger/smaller value no more than 1.5 * IQR (interquartile range, or distance between the first and third quartiles). In all, 95% confidence intervals (CI) of mean differences between +UV and NO UV of log2 counts were calculated for 10,000 samplings of 100 data points with replacement from each population. Effect sizes of log2 counts between irradiated and nonirradiated samples were calculated by using Cohen’s method (CES).

