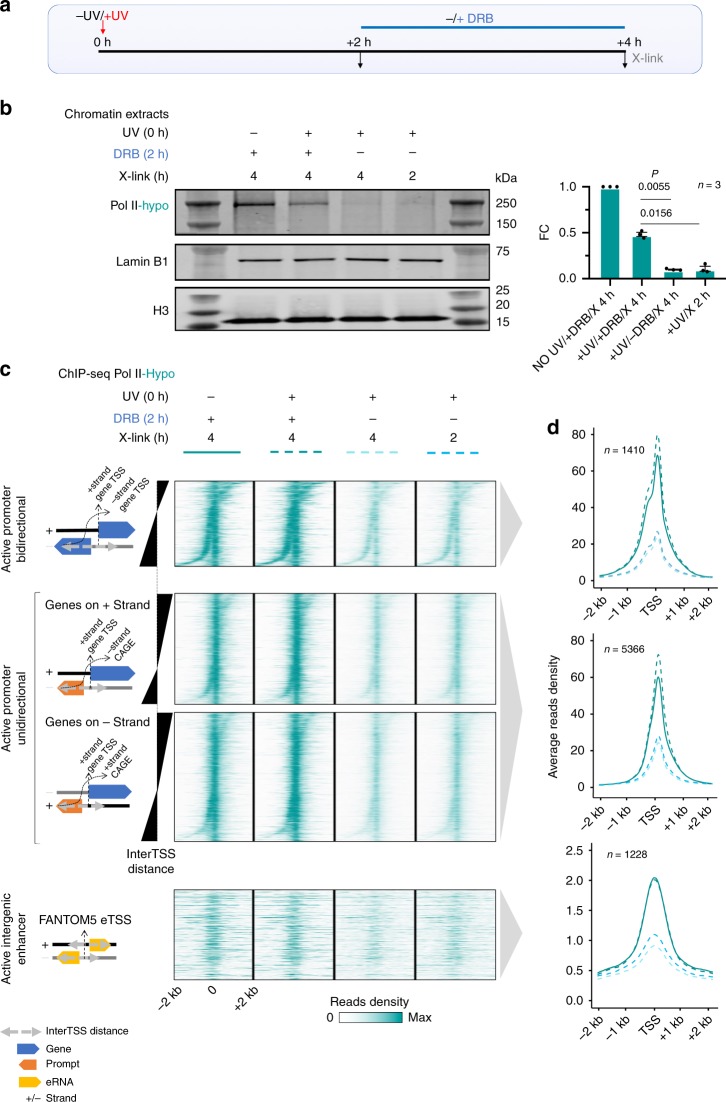
Fig. 4. DRB rescues pre-initiating Pol II levels following DNA damage.
a Experimental timeline showing times of UV irradiation (15 J/m2) and DRB treatment (see “Methods”). b Western blot analysis of chromatin extracts for Pol II-hypo levels as examined after employing the experimental strategy described in a. Lamin B1 and histone H3 were used as loading controls. Bar graph represents quantification of Pol II-hypo levels as compared with the NO UV/+DRB condition. Data shown reflect three independent experiments. Error bars represent S.E.M., and P values are calculated using two-sided Student’s t test. c Heatmap of Pol II-hypo ChIP-seq read densities in genomic regions 2 kb around TSS for categories defined in Fig. 3 a–c after performing the combination of UV/DRB treatments described in a. d Average profile plots of read densities analyzed in c.

