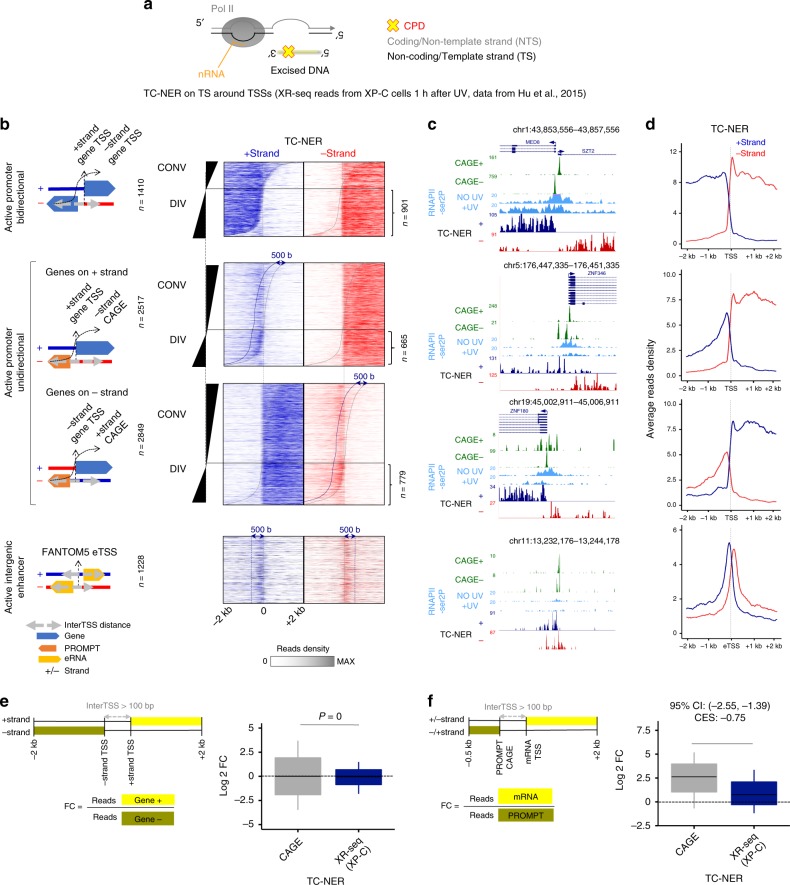
Fig. 6. TC-NER is homogeneous at all transcribed regions.
a Scheme representing the orientation and nomenclature of the DNA strands for TC-NER-specific XR-seq analysis. b Heatmaps of re-analyzed TC-NER excision reads of GG-NER-deficient cells20 (XP-C), which are detected on template strand (TS) + (blue) or − (red) strand of the genome, 2 kb around TSSs for categories defined in Fig. 3a–c (“Methods”). Dotted gray lines denote the CAGE summits detected on each strand; the dark-blue dotted lines indicate positions 500 bases downstream of CAGE summits for the corresponding strand. c UCSC genome browser snapshots of representative loci for categories defined in b. d Average profiles of read densities derived from b: only the divergent (DIV) loci were considered. e (Left panel) Scheme representing the range used for calculating Log2 FC of reads between + strand and −strand at divergent loci. (Right panel) Boxplots showing quantifications of the ratio of reads between directions (indicated window sizes and borders) at bidirectional promoters for CAGE reads (shown in Fig. 3), and TC-NER-specific XR-seq reads shown in b. Boxplots show the 25th–75th percentiles, and error bars depict data range to the larger/smaller value no more than 1.5 * IQR (interquartile range, or distance between the first and third quartiles). Two-sample F-tests were conducted for each of 10,000 sampling pairs of 100 data points with replacement from each population to test for significant differences between sample variance. The calculated P expresses the percentage of the non-significant F-tests (F-test P > = 0.05) out of all tests. f Comparison of CAGE and TC-NER-specific XR-seq reads as in e, but between divergent non-overlapping mRNA and PROMPTs (indicated window sizes and borders). In all, 95% confidence intervals (CI) of mean differences between log2 counts of tested conditions were calculated for 10,000 samplings of 100 data points with replacement from each population. Effect sizes of log2 counts between data sets were calculated using Cohen’s method (CES).

