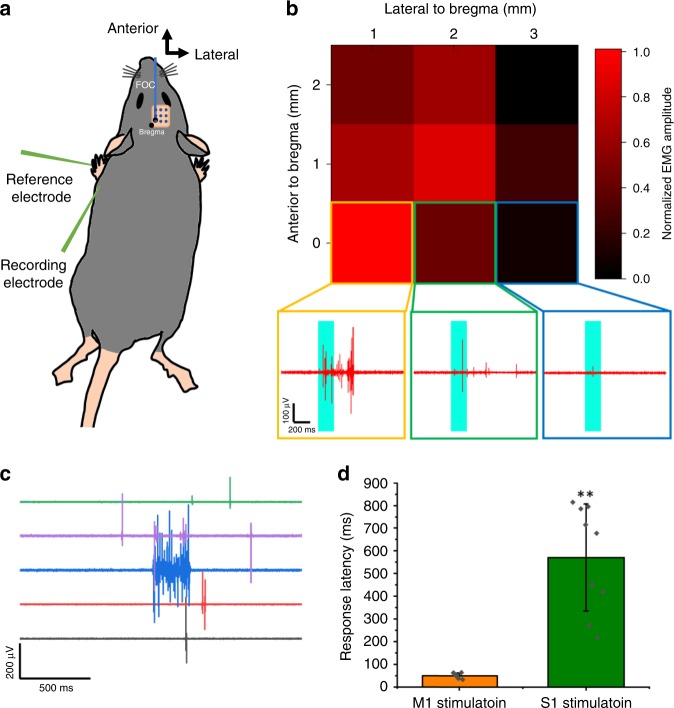
Fig. 5. Mapping of forelimb representation in the motor cortex by FOC stimulation.
a Schematic of the experiment. b Heat map showing maximum peak to peak EMG response amplitude to FOC stimulation on different locations of the motor cortex. Inserts: representative EMG traces from indicated locations. c Representative traces of forelimb EMG responses to S1 FOC stimulation. d Average delay of EMG responses to M1 and S1 stimulation. Blue box: stimulation duration. Error bars: ± SD. **p < 0.01, two-sample t-test. Source data are provided as a Source Data file.

