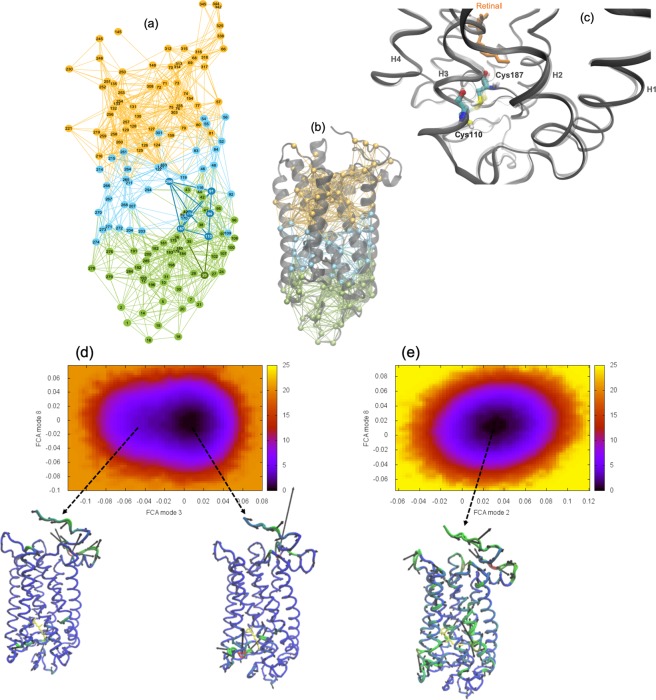
Figure 3.
(a) Localized structural fluctuation (LSF) network of interactions from a MD simulation of P23H rhodopsin in the dark, inactive-state. In the network representation of the LSFs the nodes represent C-α amino acid residues and the links between the nodes represent localized interactions. In the network representation of the LSF, we find that the connections in the inactive receptor are grouped into three separate communities. (b) The corresponding LSF is mapped onto a 3-D cartoon representation of P23H rhodopsin. (c) Overlay ribbon diagram representation of the extracellular (EC) backbone of dark-state WT rhodopsin (gray, transparent) and P23H rhodopsin (gray). A ball-and-stick representation of WT (transparent) and P23H (CPK coloring) residues Cys110 and Cys187 are also displayed showing the ruptured bond in P23H when compared with the WT receptor. Free energy surfaces derived from the full correlation analyses (FCA) of the MD trajectories of (d) WT and (e) P23H rhodopsin. The C-α representation of the rhodopsin molecules illustrate the dominant motion within the minimum of the energy surfaces where regions colored in red show greater mobility and regions in blue have less mobility.

