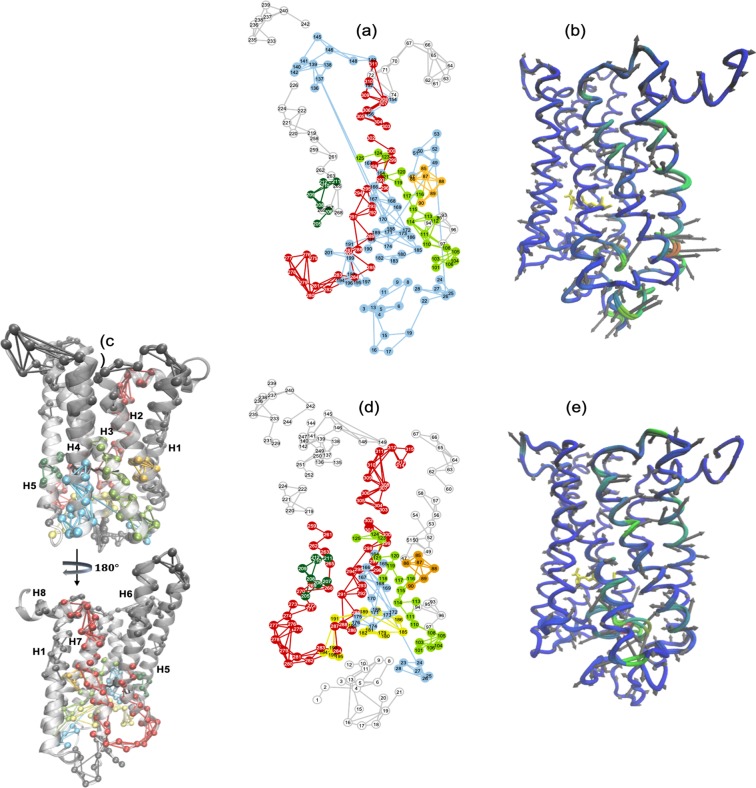
Figure 4.
(a) A 2-D mapping of the Meta-II-P23H LSF from MD simulation. The different colors in the network mapping of the LSFs represent regions of correlated fluctuations. (b) A C-α representation of the dominant PCA mode (PCA1) of Meta -II-P23H from MD simulation. Regions colored in blue represent areas of less mobility and regions in red illustrate regions with more mobility. (c) Cartoon representations of Meta-II rhodopsin showing the mapping of the Meta-II LSF from the MD simulation onto the rhodopsin 3-D structure. (d) A 2-D mapping of the Meta-II LSF and (e) the C-α representation of the PCA1 of Meta-II from MD simulation.

