Figure 6.
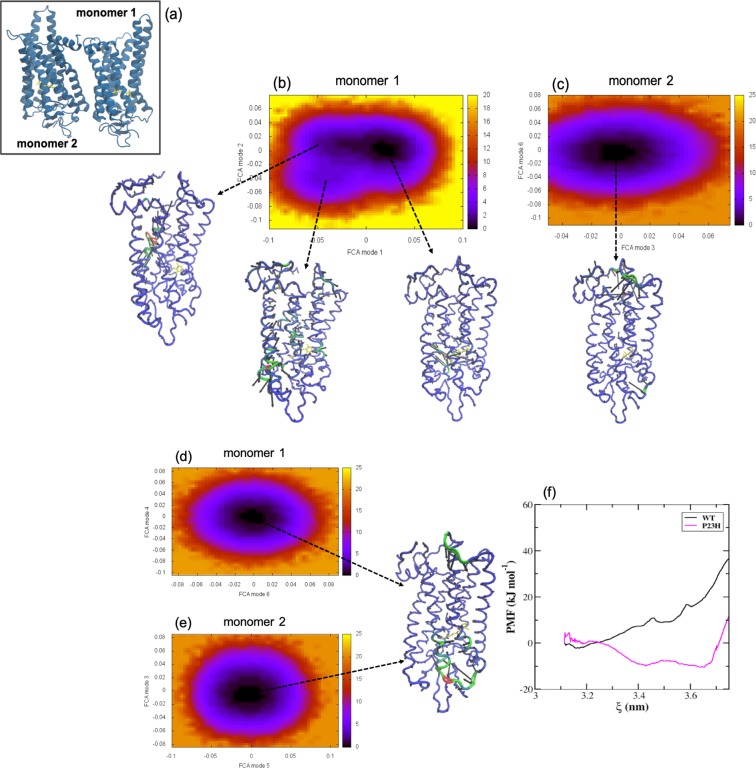
(a) Carton representation of rhodopsin molecules illustrating the arrangement of the receptors in the H1/H2/H8–H1/H2/H8 dimer. Free energy surfaces derived from the full correlation analyses (FCA) of the MD trajectories of (b) rhodopsin M1 and (c) rhodopsin M2 forming the WT H1/H2/H8–H1/H2/H8 dimer. And the FCA of P23H rhodopsin (d) M1 and (e) M2 from the MD simulations of the P23H H1/H2/H8–H1/H2/H8 dimer. The C−α representations of rhodopsin shows the principal motion within the minimum of the free energy surfaces. (f) The potential of mean force (PMF) in the inter-receptor binding region of the WT H1/H2/H8–H1/H2/H8 WT dimer (black, solid line) and the P23H H1/H2/H8–H1/H2/H8 dimer (magenta, solid line).

