Figure 1.
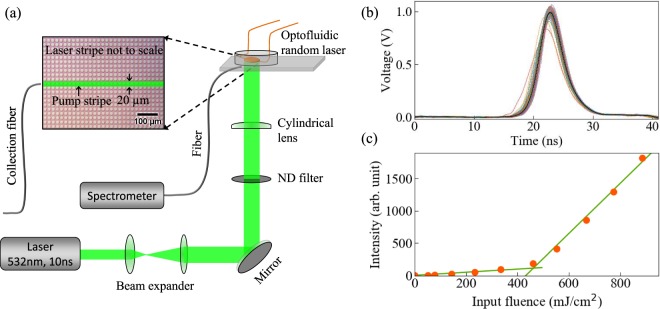
The schematic of the experimental setup with replicas of the excitation pulse and the laser threshold. (a) The ORL is pumped by a ns laser with a stripe pump geometry. The random laser emission is recorded using a fiber coupled spectrometer. The inset shows the optical microscope image of a portion of the dye-filled ORL, where the white dots are the scatterers of random sizes. (b) Temporal profiles of the pump pulse (100 shots) used to excite the ORL are shown. The pump profiles are nearly identical due to small fluctuations. Standard deviations of 1.04% confirm the replica nature of the pump, which is a necessary condition to replicate the experiment. (c) ORL emission vs input fluence is plotted, which demonstrates the typical laser threshold behavior. ORL threshold is obtained at Pth = 433.04 mJ/cm2.

