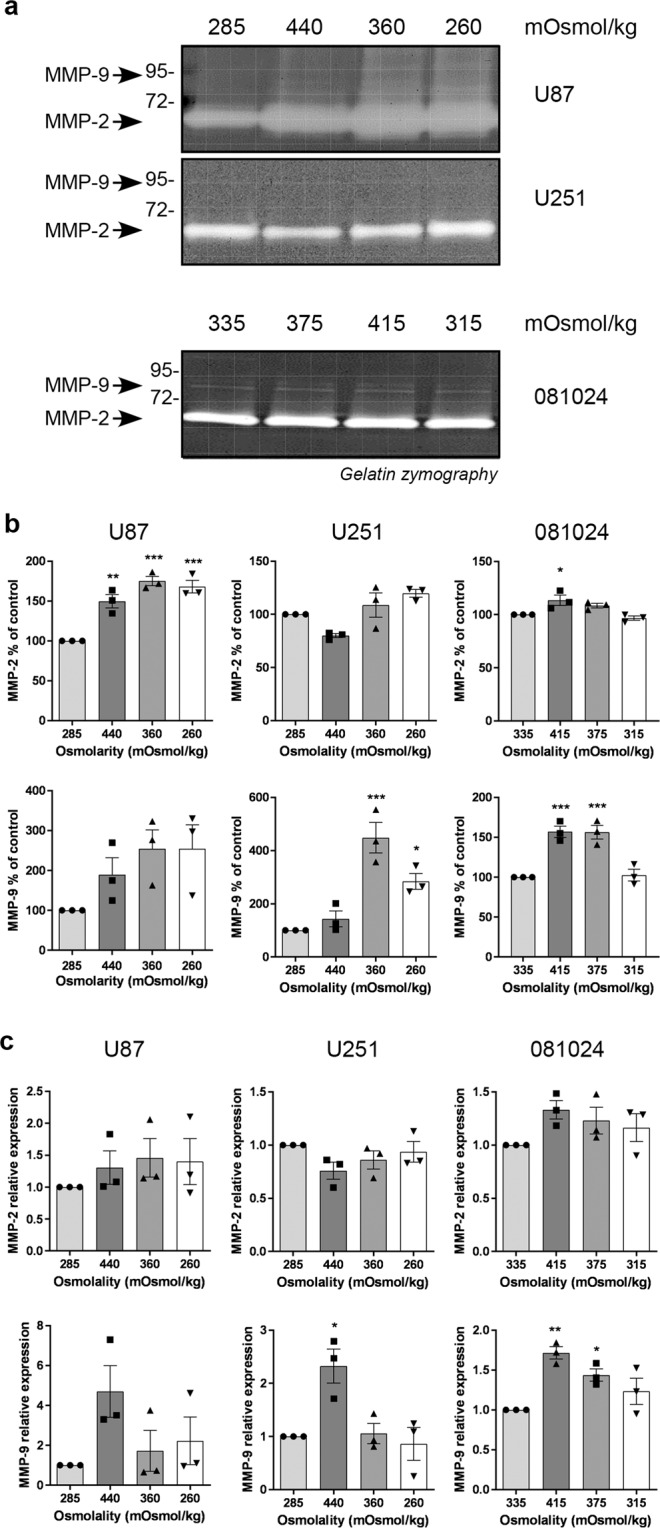
Figure 2.

Effect of osmotic pressure on MMP-2 and MMP-9 production by GBM adherent and neurosphere cells. (a) Conditioned media of cells exposed to control (285 mOsmol/kg) hyper (440 or 360 mOsmol/kg) or hypoosmotic stress (260 mOsmol/kg) were analysed by gelatin zymography. (b) Densitometric quantitation of MMP-2 and MMP-9 produced in the conditioned medium. (c) Effect of osmotic pressure on MMP-2 and MMP-9 mRNA expression. All results are expressed as mean ± SEM of n = 3 independent experiments, *p < 0.05, **p < 0.01, ***p < 0.001, one way ANOVA analysis with Dunnett’s multiple comparisons test.
