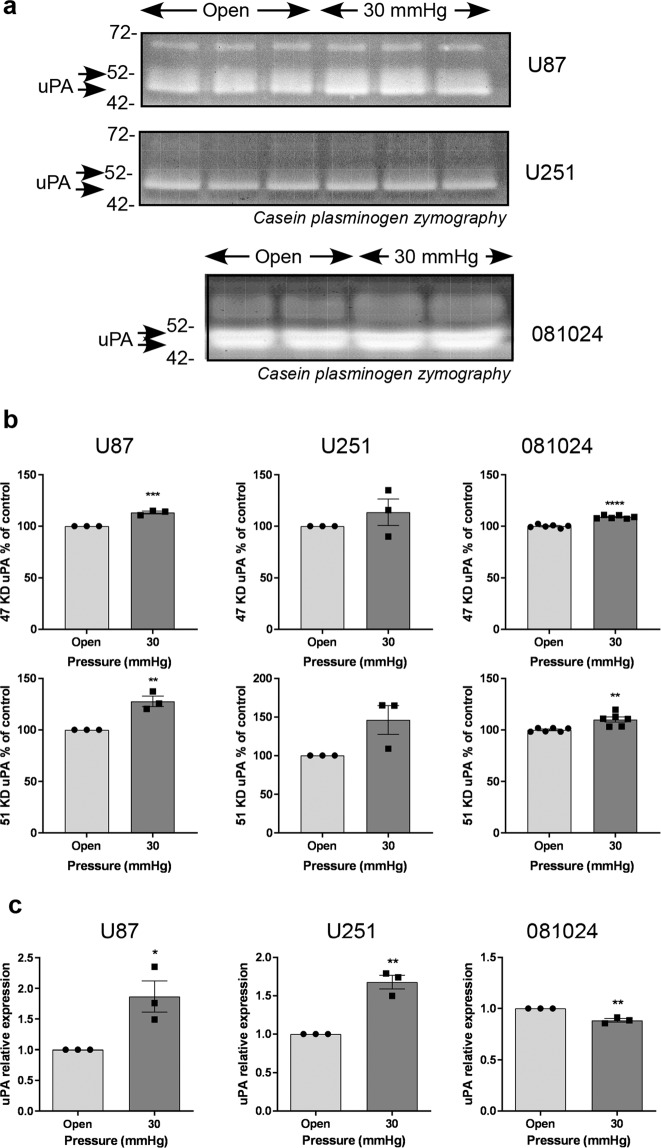
Figure 4.
Effect of hydrostatic pressure on uPA production by GBM adherent and neurosphere cells. (a) Conditioned media of cells exposed to hydrostatic pressure for 48 h were analysed by casein plasminogen zymography. (b) Densitometric quantitation of the 47 KD and 51 KD bands corresponding to uPA. (c) Effect of hydrostatic pressure on uPA mRNA expression. All results are expressed as mean ± SEM of n = 3 independent experiments, *p < 0.05, **p < 0.01, ***p < 0.001, ****p < 0.0001, unpaired Student t test.

