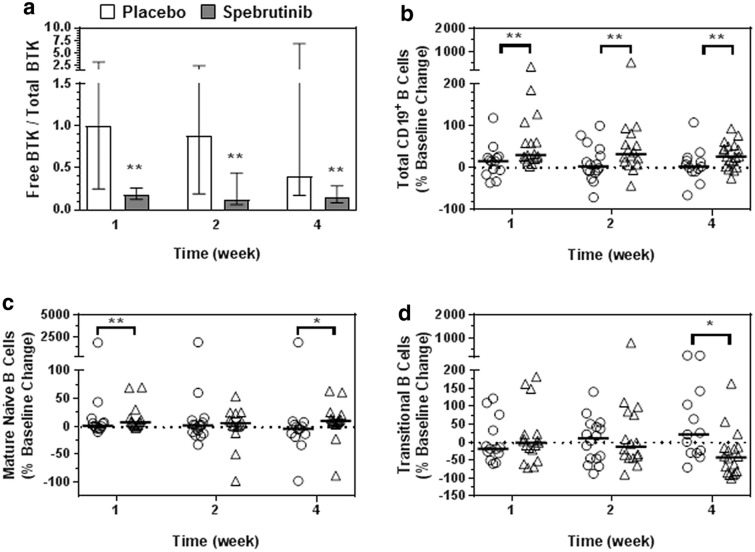
Fig. 2.
Free BTK to total BTK in PBMC and spebrutinib’s effects on B-cell subsets. a Fraction of free BTK to total BTK in PBMC and b–d effects of spebrutinib on B-cell subsets in circulation. The binding of spebrutinib to BTK in PBMC is shown in a as the ratio of free (unbound) BTK to total BTK. Flow cytometry analysis of whole blood from patients at the indicated times post-treatment are shown as b percent change from baseline for CD19+ total B cells, c CD19+CD27−CD38−IgD+ mature naive B cells, and d CD19+CD27−CD38+ transitional B cells at weeks 1, 2, and 4. Data are represented as median values ± 95% confidence interval of placebo (open circles) and spebrutinib treatment (open triangles). *P < 0.05; **P < 0.01 versus collection date-matched placebo. BTK Bruton’s tyrosine kinase, PBMC peripheral blood mononuclear cells

