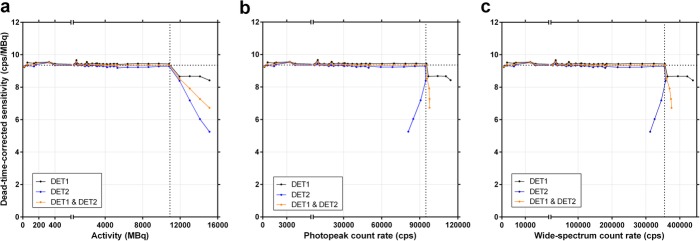
Fig. 7.
Dead-time-corrected planar sensitivity (observed primary photons count rate per activity) in function of activity (a), photopeak count rate (b, 187–229 keV) and wide-spectrum count rate (c, 18–680 keV). The horizontal dotted lines indicate the averaged calibration factor for both detectors (9.4 cps/MBq). The vertical dotted lines indicate the last point within the usable operating ranges of the system. Data is shown for each detector separately, and averaged

