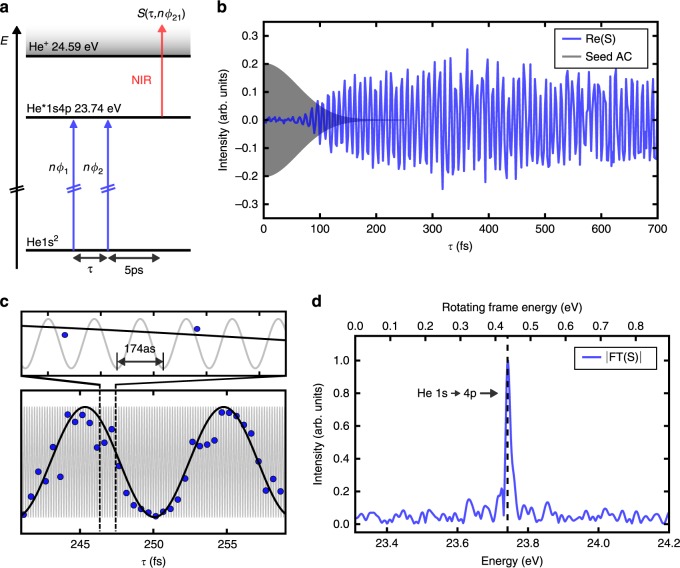
Fig. 3. XUV electronic coherence in helium.
a Energy scheme of helium with relevant levels and interaction pathways. b Real part of the downshifted WP signal, with the delay incremented in 2 fs steps. Temporal overlap region of seed pulses is indicated (gray area). Each data point corresponds to only 640 consecutive FEL shots, no additional data filtering was applied. c Data points taken with delay increment of 500 as (blue) compared to downshifted oscillation frequency of the excited transition (black). For comparison, the gray curve shows the theoretical rapid oscillation, that would be obtained without rotating frame detection (T = 174 as, see also inset). Due to rotating frame detection, we get a frequency downshift by a factor of ≈ 52, transferring the attosecond beats to the femtosecond regime. d Fourier transform (absolute value) of the signal, showing the He 1s → 4p resonance. The upper energy scale shows the downshifted frequency range obtained by rotating frame detection, the lower energy scale shows corresponding absolute energy values.

