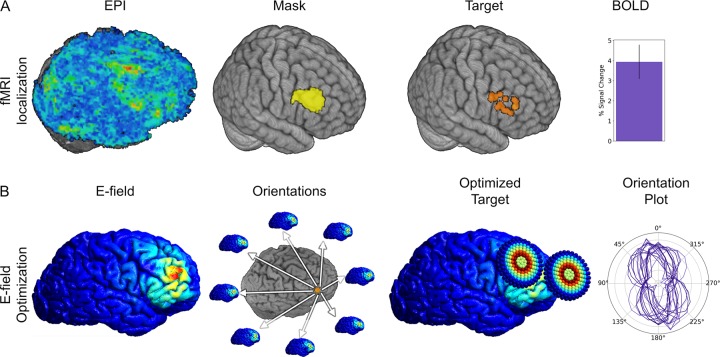
Fig. 2. fMRI data and Electric-field (E-field) models used for target localization.
a Pipeline for fMRI localization EPI maps are created for the sort > low contrast. These were sampled using a group-level mask. The peak within the mask was extracted and used as the TMS target (figure shows targets used for all subjects). BOLD activity was extracted from targets and averaged across subjects. Bar indicates Mean ± SEM. b E-field models were calculated at the target for each subject. This was repeated across 24 equally spaced coil handle orientations. The optimized target was defined as the coil handle orientation that generated the largest e-field at the target location. An orientation plot was generated showing the e-field amplitude plotted as a function of the coil handle orientation for each subject. Lines correspond to single-subject e-field model amplitudes.

