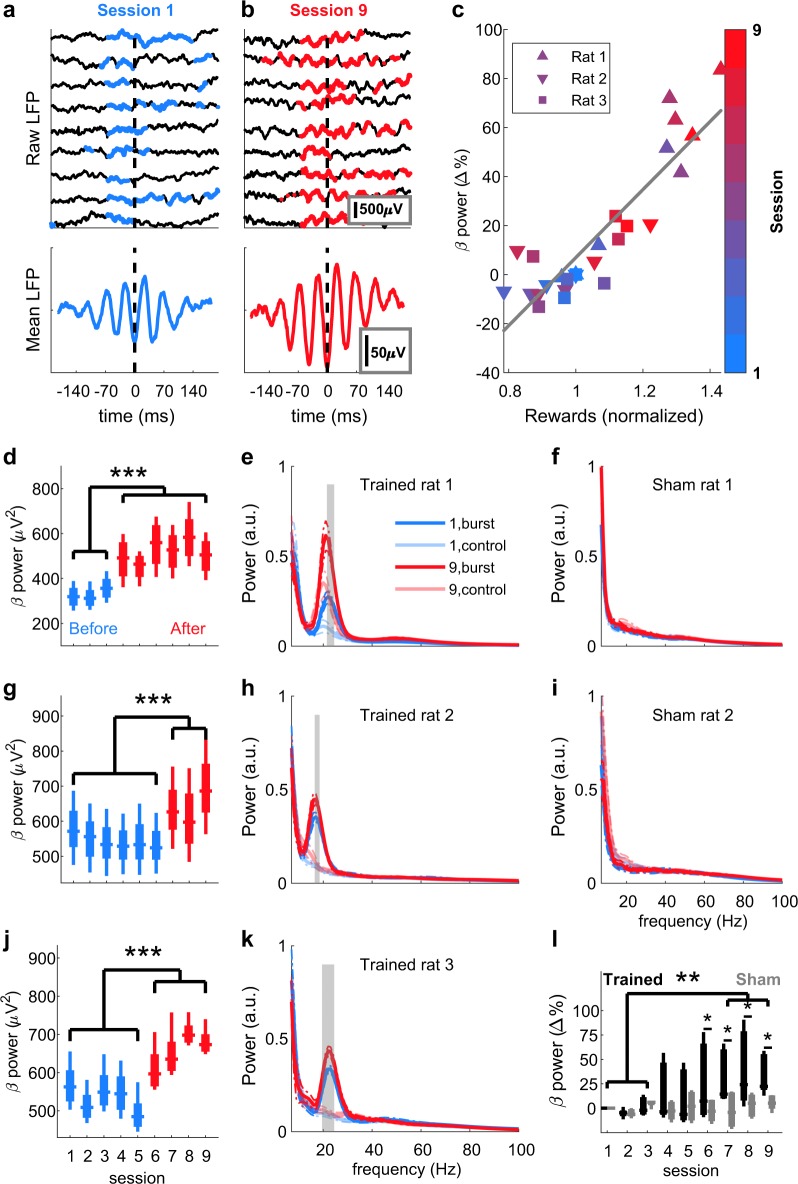
Fig. 3. Neurofeedback increases β-burst power.
Examples of raw LFP traces from the first (a, top) and last (b, top) of the nine neurofeedback training sessions. Time points in which beta-power exceeded the threshold defined as the 98th percentile are marked in blue (a) or red (b). Reward was delivered at time = 0. The heterogeneity of the individual bursts disappeared when averaging all bursts of one session, resulting in a sustained oscillation (a, b, bottom). c Correlation between number of rewards and session mean beta-power relative to session 1 for each rat in each session. Colours indicate the session number and each rat is denoted with a different shape. Pearson’s ρ = 0.89, p = 5.9 × 10⁻¹⁰. Mean power analysis of the targeted beta frequencies (20–25 Hz for rats 1 and 3 [d and j], 15–20 Hz for rat 2[g]) revealed for each rat a significant increase in power in a certain session (aha-moment) that persisted until the end of the experiment. Sessions before the aha-moment are represented in blue, and after the aha-moment in red. Two-way ANOVA (frequency and session), effect for session: rat 1: F(5,8) = 101.99, p = 3.81 × 10⁻²⁴, rat 2: F(5,8) = 85.73, p = 10−22, rat 3: F(5,8) = 248.85, p = 1.29 × 10⁻³¹. ***p < 5.19 × 10⁻⁶, multiple comparisons with Bonferroni correction. Analysis of the broadband power 200 ms prior to reward delivery in a session before (blue) and after (red) neurofeedback training (e, h, k) or sham training (f, i) is plotted as mean ± 95% confidence interval (dashed). Faded lines: power 200 ms post reward delivery. Grey shading: frequencies in which the difference between power before and power after reward was significantly (p < 0.01) different after training compared to before training (t-test with Bonferroni correction). Digits (1 or 9) in the legend in e indicate the session numbers, “burst” refers to 200 ms prior to rewards and “control” to 200 ms after reward. l Group averaged beta-power change relative to the first session. Three-way ANOVA (rat, session and treatment), effect for session: trained: F(8,16) = 2.864, p = 0.0349, sham: F(8,8) = 0.385, p = 0.9. Effect for treatment: F(1,35) = 4.99, p = 0.032. **p < 0.01, *p < 0.05, multiple comparisons with Bonferroni correction. Presented elements in d, g, j, l centre line: median; box limits: upper and lower quartiles; whiskers: full distribution.

