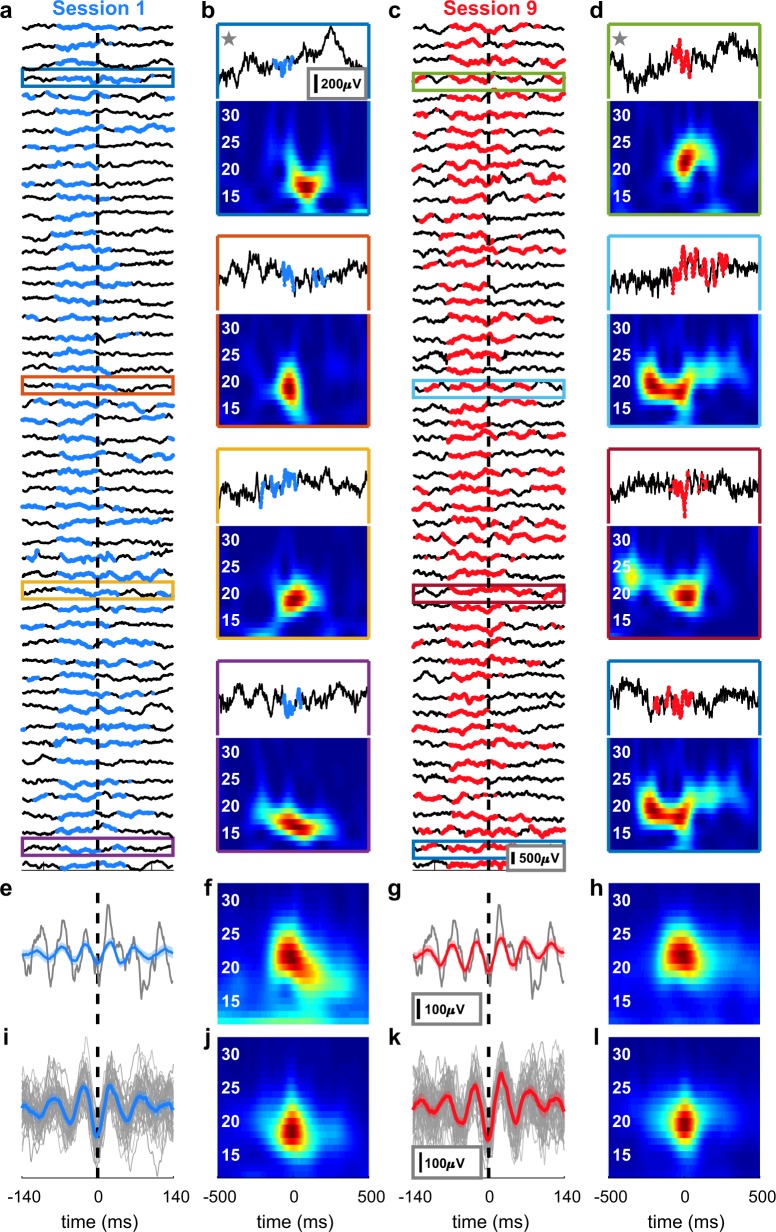
Fig. 4. Examples and characterization of beta bursts.
a Raw LFP traces of the first 50 rewards in the first session. b Examples of traces from a with the corresponding time-frequency representation. Coloured outlines refer to the traces in a. c, d Identical analysis as in a and b but for the last session. e, g Means of all bursts in the time domain for sessions 1 (blue) and 9 (red), respectively, aligned to the first trough of beta before a reward (black dashed line). Grey: raw trace of one example reward indicated with a star in b and d (respectively). f, h Means of all bursts in the frequency domain for session 1 and session 9, respectively. Although the bursts differed from each other in both the time and frequency domains, averaging led to a misleading appearance of a sustained oscillation (e, g) or a smoothed Gaussian (f, h). i Raw traces (grey) and mean (blue) of the strongest 50 bursts in the session exhibit a characteristic appearance of a trough and two smaller peaks, as previously described5. This standard waveform was preserved through training (k). j, l Time-frequency representation of i and k (respectively). Shaded areas in e, g, j and k: 95% confidence interval.

