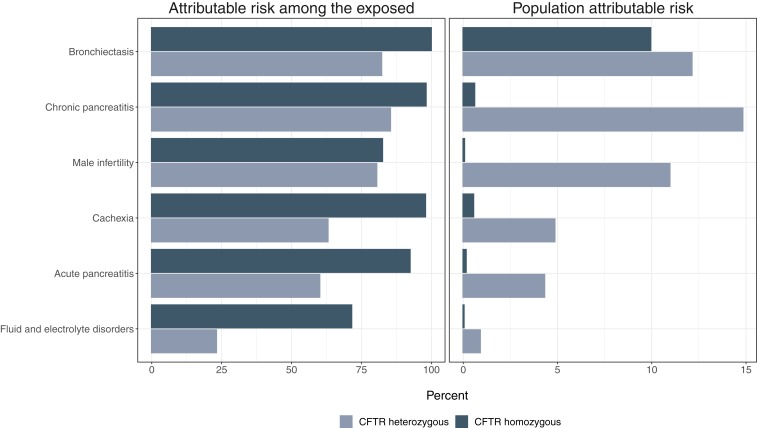
Fig. 1.
Bar graph illustrating the difference in attributable risk percent (Left) and population-attributable risk percent (Right) for individuals heterozygous (light gray) and homozygous (dark gray) for mutated CFTR alleles, for selected CF-linked diseases. It can be seen that attributable risk for a given disease is higher in those with cystic fibrosis than in CF gene carriers. However, because of the higher prevalence of CFTR heterozygosity than homozygosity, the PAR% for these diseases is higher (generally, far higher) for CF gene carriers than for those with cystic fibrosis. An exception is bronchiectasis, where an extraordinarily high odds ratio in those with cystic fibrosis (∼920) results in similar PAR% estimates (12% for CF carriers vs. 9% for individuals with cystic fibrosis). Data for this bar graph are derived from Miller et al. (6). Prevalence estimates are as noted in the text.

