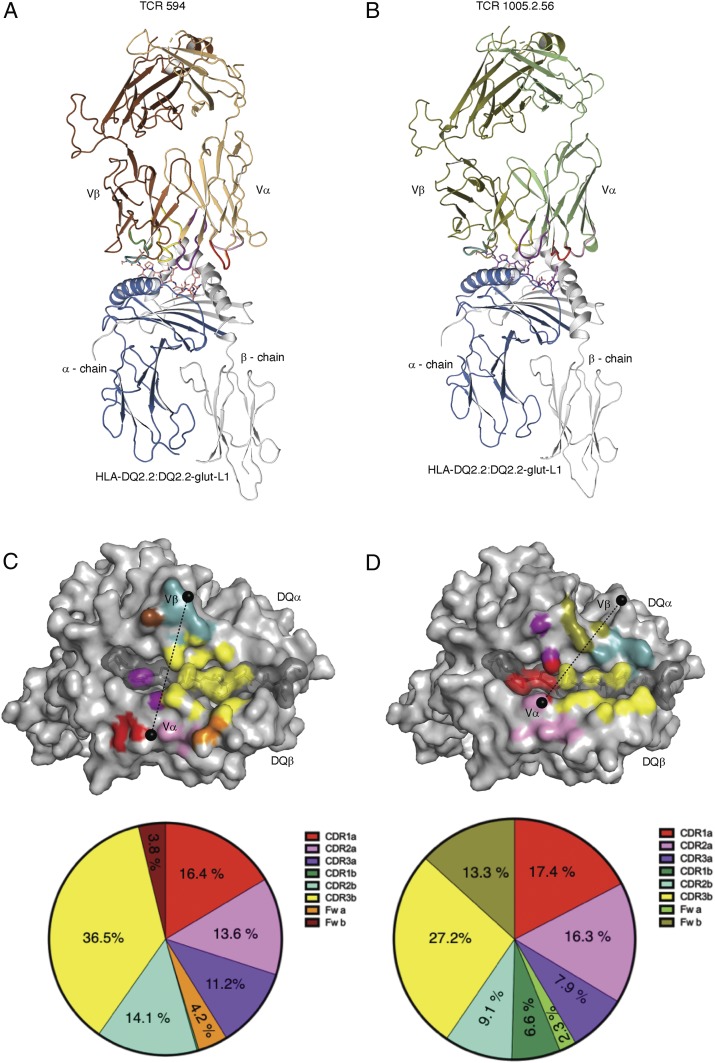
Fig. 1.
Structures of TCR-HLA-DQ2.2:DQ2.2-glut-L1 ternary complexes. TCR 594 (A) and TCR 1005.2.56 (B). Footprint of the CDR loops of the TCR 594 (C) and TCR 1005.2.56 (D) on the HLA-DQ2.2:DQ2.2-glut-L1. CDR1α, CDR2α, and CDR3α are colored in red, pink, and purple, respectively, while the CDR1β, CDR2β, and CDR3β are colored in green, light teal, and yellow, respectively. The TCR framework for each Vα- and Vβ-chain is colored orange and brown, respectively, for TCR 594, and colored lime and deep-olive, respectively, for TCR 1005.2.56. The pie chart below show percentage of the CDR loops contributing to the buried surface area.

