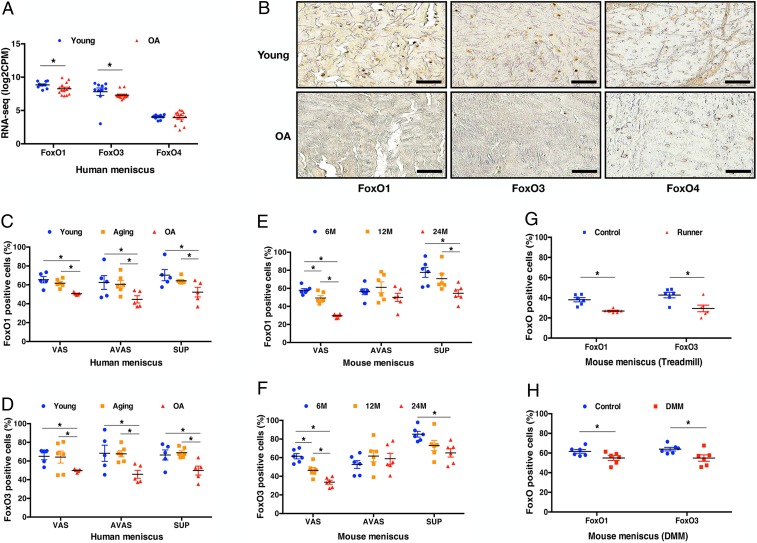
Fig. 1.
FoxO expression in human and mouse meniscus. (A) RNA-seq of young (n = 5, 19 ± 1 y), and OA (n = 7, 68 ± 4 y) human menisci. (B) Immunohistochemistry of FoxO1, FoxO3, and FoxO4 in human young and OA menisci. (Scale bar: 50 μm.) FoxO expression percentage in young (25 ± 1 y), aging (56 ± 1 y), and OA (72 ± 6 y) human menisci; (C) FoxO1; and (D) FoxO3 (n = 5 to 6 per group, *P < 0.05) VAS, vascular; AVAS, avascular; SUP, superficial). FoxO expression percentage in normal mouse meniscus; (E) FoxO1 expression at different ages (6, 12, and 24 mo) in different meniscus regions; (F) FoxO3 expression at different ages (6, 12, and 24 mo) in different meniscus regions (n = 6 per group, *P < 0.05). FoxO expression percentage in mouse meniscus after 6-wk treadmill running of 6-mo-old mice; (G) comparison of FoxO1 and FoxO3 in the entire meniscus between control and treadmill running model; (H) comparison of FoxO1 and FoxO3 expression in the entire meniscus between control and DMM model (n = 6 per group, *P < 0.05).

