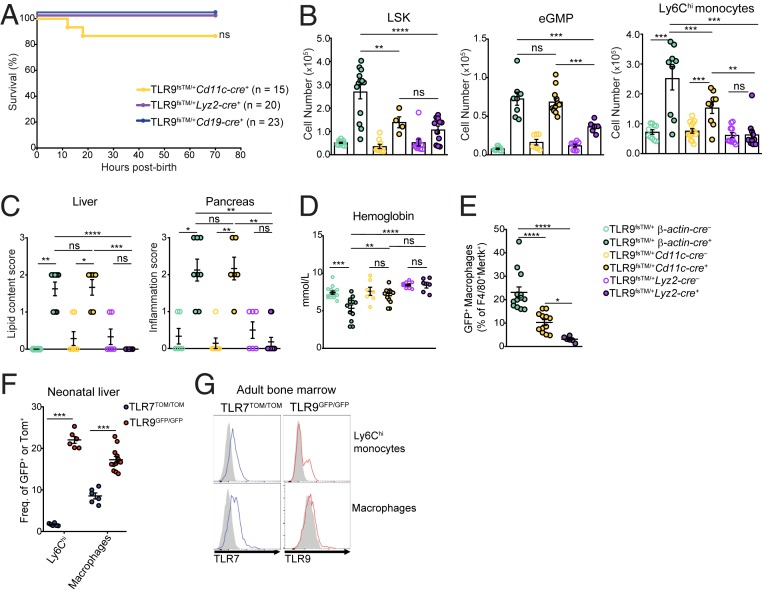
Fig. 3.
Expression of dysregulated TLR9 by neonatal macrophages and Ly6Chi monocytes correlates with liver inflammation and pancreatitis. (A) Survival curve of indicated genotypes. Results are combined from multiple litters and analyzed using Log-rank (Mantel-Cox) test. (B) TLR9fsTM/+ β-actin-cre+ and TLR9fsTM/+ Cd11c-cre+ neonates exhibit an increase in LSK, eGMP, and Ly6Chi monocyte cell populations in the liver compared with TLR9fsTM/+ Lyz2-cre+ neonates. Data combined from multiple litters are shown as mean ± SEM and analyzed using one-way ANOVA with Tukey’s multiple comparisons posttest. Mouse numbers: TLR9fsTM/+ β-actin-cre–, n = 15; TLR9fsTM/+ β-actin-cre+, n = 13; TLR9fsTM/+ Cd11c-cre–, n = 9; TLR9fsTM/+ Cd11c-cre+, n = 4 and n = 10; TLR9fsTM/+ Lyz2-cre–, n = 10; TLR9fsTM/+ Lyz2-cre+, n = 11. (C) Histology scores of liver (Left) and pancreas (Right) sections from the indicated mice. Pathology scoring scheme for liver: 0 = hepatocytes contain diffuse cytoplasmic lipid vacuoles; 1 = hepatocytes contain many small cytoplasmic lipid vacuoles; 2 = hepatocytes contain a few small cytoplasmic lipid vacuoles; 3 = hepatocytes contain no lipid. Pathology scoring scheme for pancreas: inflammation with exocrine cell necrosis or zymogen depletion or both: 0 = unaffected; 1 = minimal diffuse to mild multifocal; 2 = mild diffuse to moderate multifocal; 3 = moderate diffuse to marked multifocal. Data are combined from multiple experiments and analyzed using Kruskal–Wallis ANOVA and Dunn’s multiple comparisons test. Mouse numbers: TLR9fsTM/+ β-actin-cre–, n = 6; TLR9fsTM/+ β-actin-cre+, n = 8; TLR9fsTM/+ Cd11c-cre–, n = 7; TLR9fsTM/+ Cd11c-cre+, n = 6; TLR9fsTM/+ Lyz2-cre–, n = 6; TLR9fsTM/+ Lyz2-cre+, n = 11. (D) TLR9fsTM/+ β-actin-cre+ neonates suffer from anemia. Blood hemoglobin levels from the indicated mice are shown. Results combined from multiple experiments are shown as mean ± SEM and analyzed using one-way ANOVA with Tukey’s multiple comparisons posttest. Mouse numbers: TLR9fsTM/+ β-actin-cre–, n = 14, TLR9fsTM/+ β-actin-cre+, n = 12; TLR9fsTM/+ Cd11c-cre–, n = 7; TLR9fsTM/+ Cd11c-cre+, n = 7; TLR9fsTM/+ Lyz2-cre–, n = 8; TLR9fsTM/+ Lyz2-cre+, n = 6. (E) The frequency of TLR9-expressing neonatal macrophages correlates with disease severity. Quantification of CD45+CD3e–CD19–Ly6G–CD11b+F4/80+Mertk+ TLR9 (GFP+) macrophages from the neonatal livers of the indicated genotypes. Results combined from multiple experiments are shown as mean ± SEM and analyzed using one-way ANOVA with Tukey’s multiple comparisons posttest. Mouse numbers: TLR9fsTM/+ β-actin-cre+, n = 13; TLR9fsTM/+ Cd11c-cre+, n = 12; TLR9fsTM/+ Lyz2-cre+, n = 6. (F) The frequency of macrophages and Ly6Chi monocytes expressing TLR9 (GFP+) and TLR7 (TdTomato+). Results combined from multiple experiments are shown as mean ± SEM and analyzed using the two-tailed Student’s t test. Mouse numbers: TLR9GFP/GFP, n = 12; TLR7TOM/TOM, n = 6. (G) Representative histograms of TLR9 and TLR7 expression in Ly6Chi monocytes and macrophages (CD45+CD3e–CD19–Ly6G–Ly6C–CD11b+F4/80+) from adult bone marrow from TLR9GFP/GFP or TLR7TOM/TOM reporter mice compared with B6 WT controls (gray). In all panels, *P < 0.05; **P < 0.01; ***P < 0.001; ****P < 0.0001.

