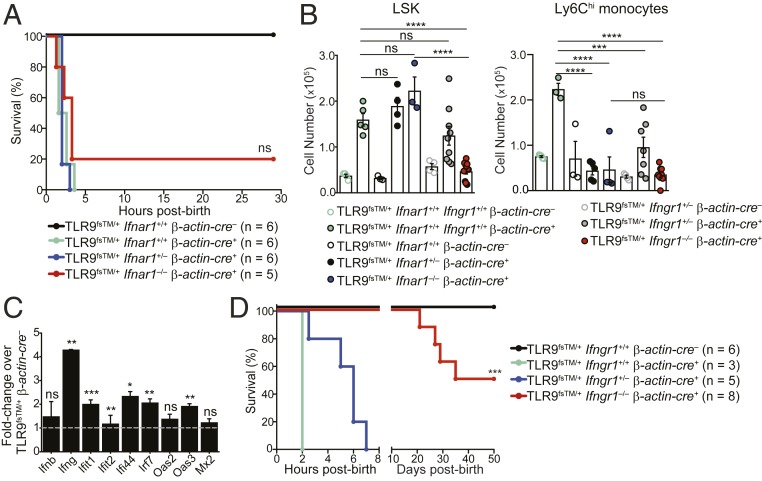
Fig. 4.
Fatal inflammation in TLR9TM-expressing neonates requires IFN-γ receptor signaling but not type I IFN signaling. (A) Survival curves of TLR9fsTM/+β-actin-cre+Ifnar1−/− neonates. Results are combined from multiple litters and analyzed using the logrank (Mantel–Cox) test. (B) LSK and Ly6Chi monocyte cell populations do not expand in TLR9fsTM/+β-actin-cre+Ifngr1−/− neonates. Quantification of LSK and Ly6Chi monocytes from neonatal livers of indicated genotypes (combined from multiple litters) is shown as mean ± SEM and analyzed using one-way ANOVA with Tukey’s multiple comparisons posttest. Mouse numbers: TLR9fsTM/+ β-actin-cre–, n = 4; TLR9fsTM/+ β-actin-cre+, n = 5; TLR9fsTM/+β-actin-cre–Ifnar1+/+, n = 4; TLR9fsTM/+β-actin-cre+Ifnar1+/−, n = 4; TLR9fsTM/+β-actin-cre+Ifnar1−/−, n = 3; TLR9fsTM/+β-actin-cre–Ifngr1+/−, n = 4; TLR9fsTM/+β-actin-cre+Ifngr1+/−, n = 7; TLR9fsTM/+β-actin-cre+Ifngr1−/−, n = 9. (C) Quantitative PCR analysis of inflammatory genes in TLR9fsTM/+β-actin-cre+ neonatal livers. Data are representative of two independent experiments and presented as fold change of expression in TLR9fsTM/+β-actin-cre+ vs. TLR9fsTM/+ β-actin-cre–. Bars show mean ± SD; statistics calculated using the two-tailed Student’s t test. (D) Survival curves of TLR9fsTM/+β-actin-cre+Ifngr1−/− neonates. Results are combined from multiple litters and analyzed using the logrank (Mantel-Cox) test. In all panels, *P < 0.05; **P < 0.01; ***P < 0.001; ****P < 0.0001.

