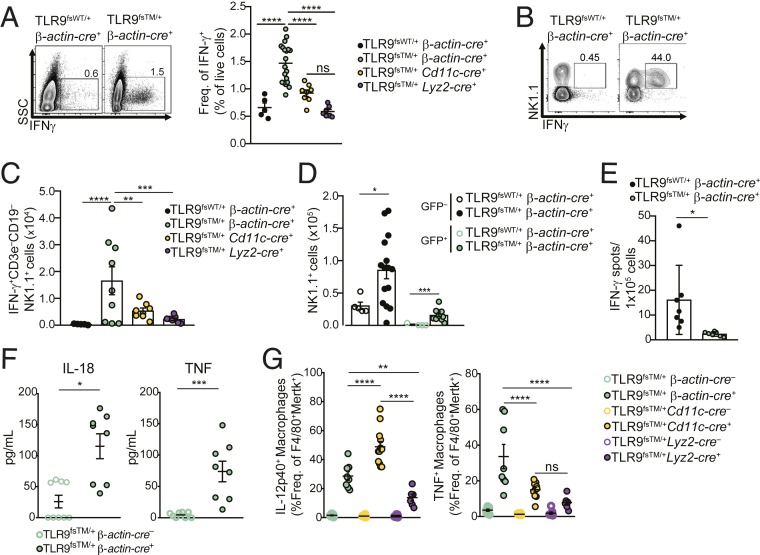
Fig. 5.
Expansion of IFN-γ–producing NK cells correlates with neonatal inflammation. (A, Left) Representative flow cytometry plots of IFN-γ–producing cells in neonatal livers of TLR9fsWT/+β-actin-cre+ and TLR9fsTM/+β-actin-cre+ mice. (A, Right) Quantification of IFN-γ+ cells in neonatal livers of mice of the indicated genotypes. Data combined from multiple litters are shown as mean ± SEM and analyzed using one-way ANOVA with Tukey’s multiple comparisons posttest. Mouse numbers: TLR9fsWT/+ β-actin-cre+, n = 5; TLR9fsTM/+ β-actin-cre+, n = 19; TLR9fsTM/+ Cd11c-cre+, n = 8; TLR9fsTM/+ Lyz2-cre+, n = 7. (B) Expansion of IFN-γ+ NK1.1+ cells in TLR9fsTM/+β-actin-cre+ neonates. Shown are representative flow cytometry plots of NK1.1 and IFN-γ staining on CD3–CD19–NK1.1+ gated cells from neonatal livers of the indicated mice. (C) Quantification of IFN-γ+CD3–CD19–NK1.1+ subsets of indicated genotypes. Results from multiple litters are shown as mean ± SEM and analyzed using one-way ANOVA with Tukey’s multiple comparisons posttest. Mouse numbers: TLR9fsWT/+ β-actin-cre+, n = 5; TLR9fsTM/+ β-actin-cre+, n = 9; TLR9fsTM/+ Cd11c-cre+, n = 8; TLR9fsTM/+ Lyz2-cre+, n = 7. (D) Quantification of GFP+ and GFP– CD3–CD19–NK1.1+ cells in neonatal livers. Results are combined from multiple litters and shown as mean ± SEM and analyzed using the two-tailed Student’s t test. Mouse numbers: TLR9fsWT/+ β-actin-cre+, n = 5; TLR9fsTM/+ β-actin-cre+, n = 15. (E) Analysis of IFN-γ secretion by GFP+ and GFP– total cells by ELISpot. Quantification of IFN-γ secreting cells of indicated genotypes. Results combined from multiple litters are shown as mean ± SEM and analyzed using the two-tailed Student’s t test. Mouse numbers: TLR9fsWT/+ β-actin-cre+, n = 7; TLR9fsTM/+ β-actin-cre+, n = 7. (F) Neonatal liver cells from TLR9fsTM/+ B-actin-cre+ mice secrete more IL-18 and TNF compared to littermate controls. Shown are cytokine levels of adherent fetal liver cells cultured from TLR9fsTM/+ β-actin-cre+ and TLR9fsTM/+ β-actin-cre– neonates. Results are combined from two independent experiments and analyzed using the two-tailed Student’s t test. Mouse numbers: TLR9fsTM/+ β-actin-cre–, n = 9; TLR9fsTM/+ β-actin-cre+, n = 8. (G) Neonatal macrophages from TLR9fsTM/+ β-actin-cre+ and TLR9fsTM/+ Cd11c-cre+ neonates secrete significantly more TNF and IL-12p40 compared with TLR9fsTM/+ Lyz2-cre+ neonates. Results are combined from multiple experiments and analyzed using one-way ANOVA with Tukey’s multiple comparisons posttest. Mouse numbers: TLR9fsTM/+ β-actin-cre–, n = 10; TLR9fsTM/+ β-actin-cre+, n = 8; TLR9fsTM/+ Cd11c-cre–, n = 7; TLR9fsTM/+ Cd11c-cre+, n = 12; TLR9fsTM/+ Lyz2-cre–, n = 8; TLR9fsTM/+ Lyz2-cre+, n = 6. In all panels, *P < 0.05; **P < 0.01; ***P < 0.001; ****P < 0.0001.

