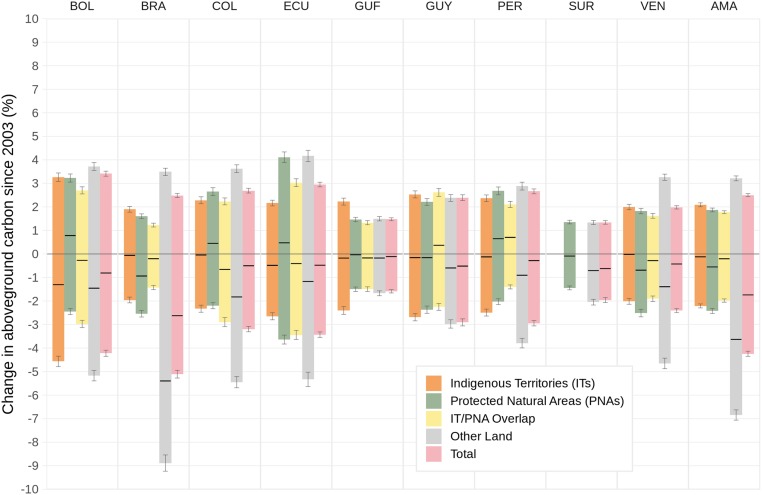
Fig. 3.
Estimates of carbon loss (negative values), carbon gain (positive values), and the net change in carbon (bold black lines) during the 2003 to 2016 period of study as a percentage of the total stock present in 2003 across Amazon ITs, PNAs, regions of IT/PNA overlap, and Other Land. Error bars reflect the 95% confidence interval for the change (loss/gain) value (SI Appendix, Table S8).

