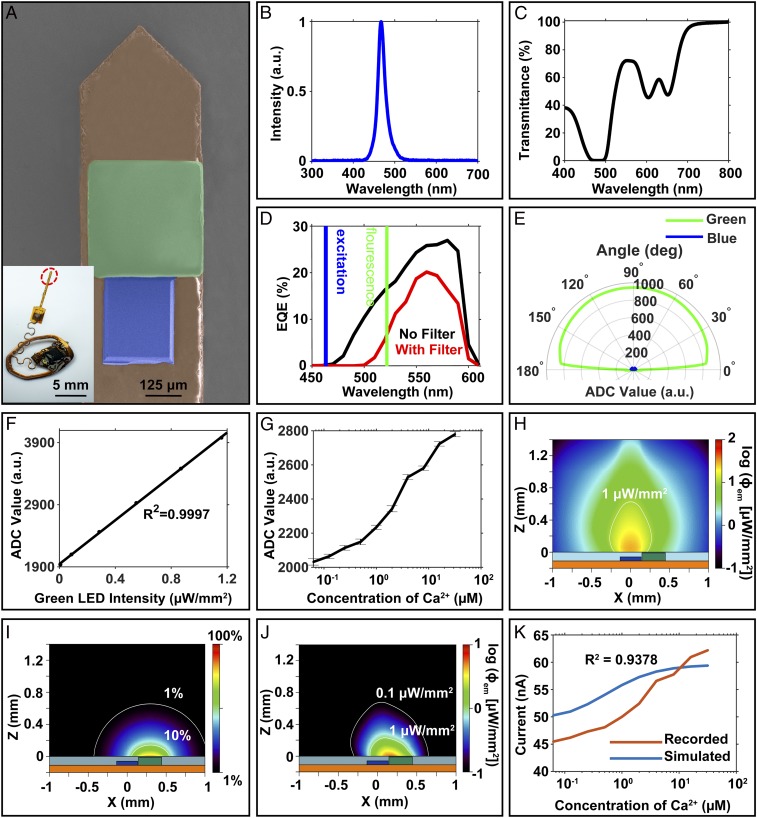
Fig. 2.
(A) Colorized SEM image of the photometry probe (orange, polyimide; blue, μ-ILED; green, μ-IPD and optical filter). (B) Normalized emission spectrum of the blue µ-ILED used for optical stimulation. (C) Transmission spectrum of an optical filter composed of layer of a photodefined epoxy (80 µm, SU-8) doped with 1.5 wt% of an organic dye as a narrow-band absorbing filter. (D) EQE spectra of a µ-IPD with (red) and without (black) an optical filter. The blue and green areas highlight EQEs under the maximum µ-ILED emission (blue) and GCaMP6f fluorescence (green) wavelength regions, respectively. (E) Angular dependence of the rejection ratio of blue (462-nm) to green (520-nm) illumination displayed in ADC readings with arbitrary units (a.u.). (F) Response of the wireless photometry device to an external green light source (520 nm). (G) Fluorescence recording with SEs for solutions with different calcium concentrations (0.0625 to 32 µM) and calcium dye (12.5 µM; Oregon Green 488 BAPTA-2). (H) Simulated spatial distribution of fluorescence fluence at a Ca2+ concentration of 32 µM and an input optical power of 0.5 mW. (I) Acceptance profile with 1% and 10% intensity contours captured by the µ-IPD at 520 nm. (J) Fluorescence density profile captured by the µ-IPD, obtained by the product of H and I. (K) Comparison between simulated and recorded photocurrents corrected for stray light transmission through the organic filter. The simulations assume perfect blue light rejection.

