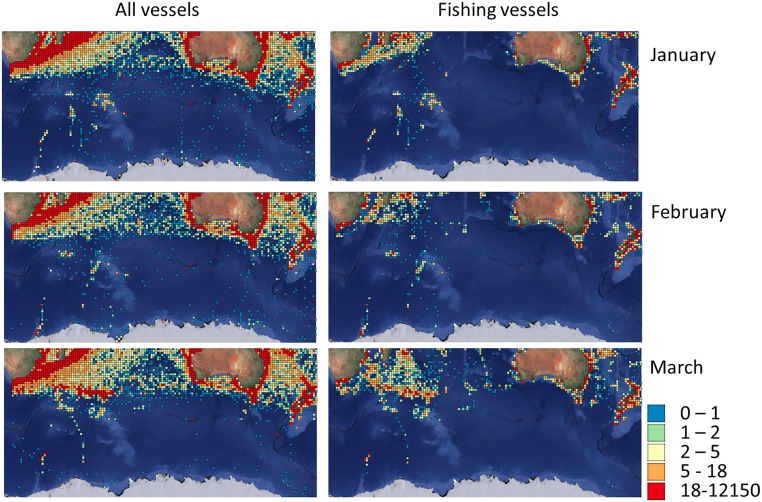
Fig. 1.
Distribution of AIS locations (for all vessels [Left] and fishing vessels only [Right]) in the study sector (south Indian Ocean between Africa and New Zealand) recorded in January, February, and March 2019. Shown is the number of vessels over 4 d randomly selected every week through each month, for squares of 125 km.

