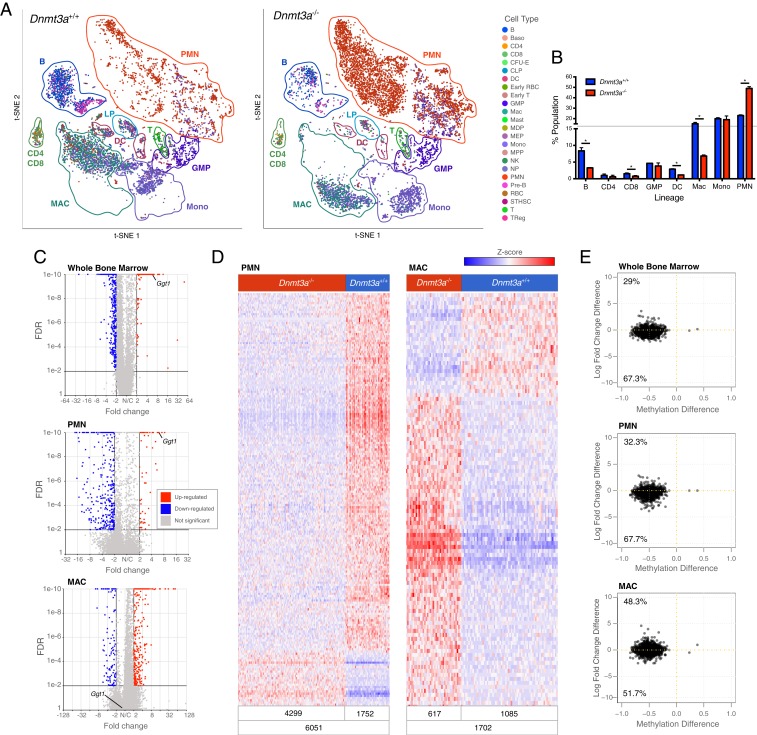
Fig. 4.
Dnmt3a−/− bone marrow cells have population-restricted DEGs, and a myeloid lineage bias. (A) The t-SNE projections of scRNA-seq data from whole bone marrow cells derived from mice transplanted with Dnmt3a+/+ (n = 2; Left) or Dnmt3a−/− donors (n = 2; Right), and showing known hematopoietic populations based on Haemopedia gene expression profiling (35). (B) Population fractions associated with the scRNA-seq data shown in A; * indicates FDR < 0.05 via Fisher’s exact test with multiple hypothesis correction. (C) Volcano plots showing DEGs in whole bone marrow, PMNs, and macrophage populations (MACs) from Dnmt3a−/− mice (FDR ≤ 0.01, FC ≤ −2, ≥ 2). (D) Heatmaps of normalized (Z-score) expression values for 388 DEGs identified in PMNs (59 up-regulated and 329 down-regulated) and 450 DEGs identified in macrophages (340 up-regulated and 110 down-regulated). Numbers of cells represented in each grouping are shown at the bottom of each heatmap. (E) Methylation difference of each DMR associated with a gene within 5 kb (x axis), plotted against the difference in expression values between Dnmt3a+/+ and Dnmt3a−/− cells (y axis). Inset numbers indicate the fraction of genes in each quadrant. Nearly all DMRs associated with genes are hypomethylated, and the majority of these genes are expressed at lower levels in Dnmt3a−/− cells.

