Fig. 5.
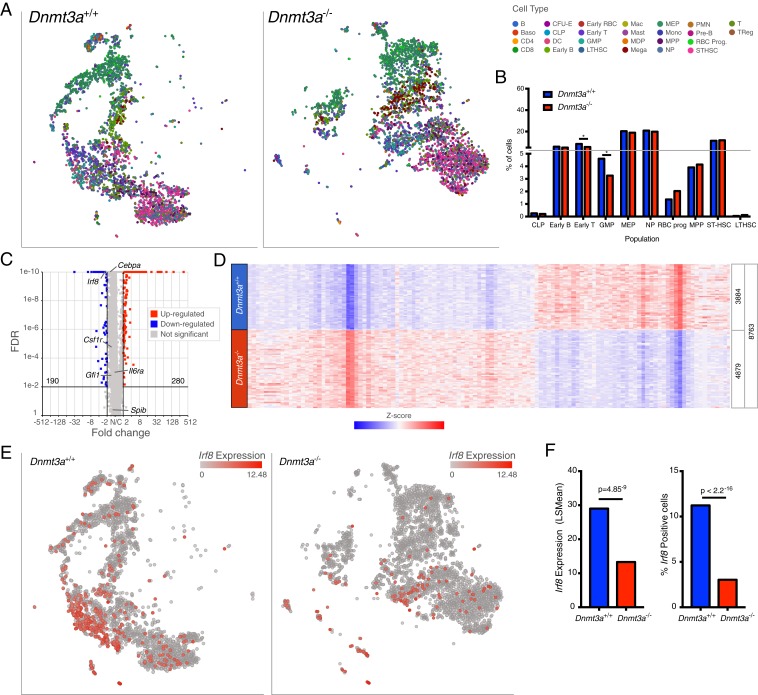
Dnmt3a−/− progenitors express reduced Irf8. (A) The t-SNE projections of scRNA-seq data from Dnmt3a+/+ (Left) and Dnmt3a−/− (Right) lineage-negative (i.e., depleted for cells expressing B220, CD19, CD11b, Ter119, and/or CD71), c-KIT−positive cells with known populations assigned according to Haemopedia gene expression profiling. (B) Population distributions assigned using the scRNA-seq data shown in A; * indicates FDR < 0.05 via Fisher’s exact test and multiple hypothesis correction. (C) Volcano plot showing DEGs in lineage-negative, c-KIT−positive cells from Dnmt3a−/− mice (FDR ≤ 0.01, fold change ≤ −2, ≥ 2). The values for several transcription factors associated with myelomonocytic lineage determination are shown. (D) Heatmap of normalized (Z-score) expression values for 470 DEGs (280 up-regulated, and 190 down-regulated) identified in lineage-negative, c-KIT−positive cells defined by the comparison of Dnmt3a+/+ vs. Dnmt3a−/−cells. Numbers of cells represented in each grouping are shown at the right of the heatmap. (E) Cells colored red according to levels of Irf8 expression in Dnmt3a+/+ (Left) and Dnmt3a−/− (Right) lineage-negative, c-KIT−positive cells. (F) Mean expression levels (Left) and fractions of cells positive for Irf8 relative to total cells (Right).

