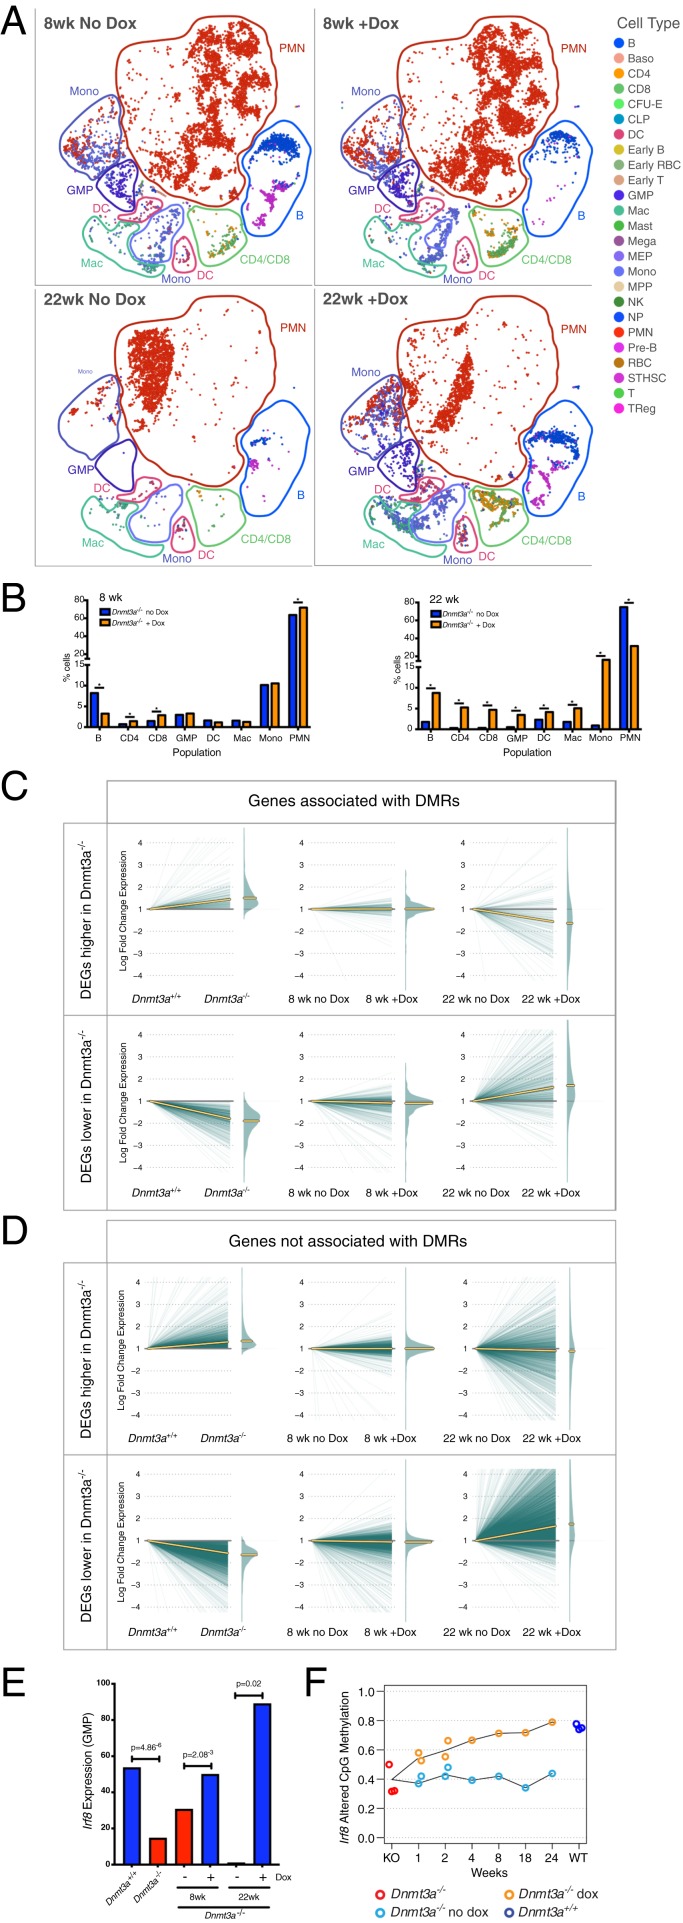
Fig. 6.
Restoring DNMT3A expression partially corrects myeloid skewing and dysregulated gene expression in Dnmt3a−/− bone marrow cells. (A) The t-SNE projections of scRNA-seq data of whole bone marrow from recipient mice transplanted with Dnmt3a null-3A addback bone marrow and fed normal chow (no Dox), or 10,000 ppm Dox chow (with Dox) for the indicated times. Known populations are annotated according to Haemopedia gene expression profiling. (B) Population percentages identified using the scRNA-seq data from 8 wk (Top) or 22 wk (Bottom) of Dox chow feeding; * indicates FDR < 0.05 via Fisher’s exact test with multiple hypothesis correction. (C) Expression changes in DEGs within 5 kb of a DMR, defined by comparing Dnmt3a+/+ vs. Dnmt3a−/− cells. Plots are split into up-regulated genes (Top) or down-regulated genes (Bottom). Left shows the log fold change difference of each gene in Dnmt3a+/+ vs. Dnmt3a−/− cells. Middle and Right passively plot the expression values for the same sets of DEGs, displaying the effects of feeding Dox for 8 or 22 wk. Yellow lines indicate the median expression value for each set of genes. (D) Identical to C, but displaying DEGs not associated with a DMR. (E) Fraction of GMPs positive for Irf8 expression in Dmnt3a+/+ (blue) vs. Dnmt3a−/− (red) bone marrow cells, identified by scRNA-seq. The expression of Irf8 in GMPs is significantly increased after 8 or 22 wk of feeding Dox chow (red vs. blue bars). (F) Remethylation of differentially methylated CpGs in the Irf8 gene body with Dox feeding (orange line). No remethylation was detected in mice fed with normal chow (blue line).

