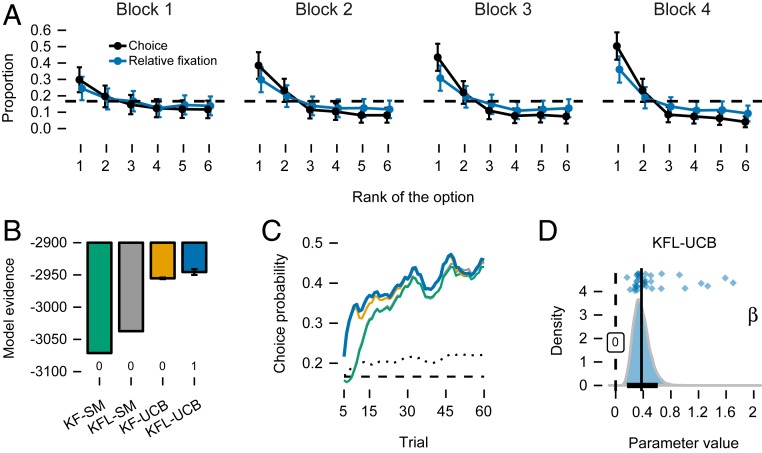
Fig. 2.
(A) Proportion of choices allocated to options with higher expected values (i.e., rank closer to 1) increased from the first to the fourth block. Relative fixation in the choice stage shows similar learning effect. Error bars are SEM. (B) Model evidence (bars) and model comparison (numbers below bars) show that KFL-UCB captures choices best. Error bars are interquartile ranges of bridge-sampling repetitions (for some models too small to be visible; SI Appendix, SI Methods). (C) Mean probability with which models predict participants’ choices are above chance level (dashed black line) and above a nonlearning model with fixed choice probabilities (dotted black line). The probability is highest for the KFL-UCB model (blue line). Means are computed over a rolling window of five trials. (D) Posterior of the group-level parameter for the KFL-UCB model that acts as a weight on uncertainty in the UCB choice rule (). The posterior mean (vertical line) and 95% CI (black bar on the x axis) show the magnitude of uncertainty influence. Dots are posterior means of individual game-level parameters.

