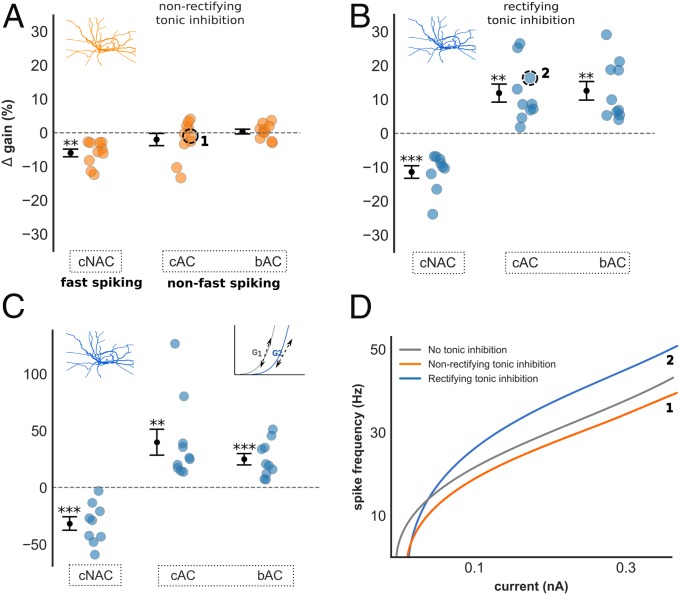
Fig. 2.
Impact of tonic inhibition on gain in interneuron models. (A–C) ∆ gain of all interneuron models grouped by E-type with nonrectifying (A) and rectifying (B) tonic inhibition. (A) Nonrectifying tonic inhibition had insignificant impact upon gain in non–fast-spiking models, and reduced gain in fast-spiking models. A small but significant difference in ∆ gain was observed between fast-spiking and non–fast-spiking models [−6.0% ± 1.1 vs. −0.8% ± 0.9; Welch’s t test, t(28) = −3.4, P < 0.01]. (B) In contrast, rectifying tonic inhibition increased gain in non–fast-spiking models, and differentially modulated gain between fast-spiking and non–fast-spiking models (−11.4% ± 1.8 vs. 12.2% ± 1.9; P < 0.001). (C) Differential gain modulation between fast-spiking and non–fast-spiking models persisted if ∆ gain was instead measured using the gradient of the I–F curve [−31.7% ± 6.0 vs. 32.4% ± 6.3; Welch’s t test, t(28) = −6.2, P < 0.001]. (D) Current–frequency relationship of one cAC (non–fast-spiking) model demonstrating changes in gain with nonrectifying (orange, labeled 1) and rectifying (blue, labeled 2) tonic inhibition. Results are presented as mean ± SEM. Asterisk denotes a significant ∆ gain value compared with ∆ gain = 0%; one-sample t test, *P < 0.05, **P < 0.01, ***P < 0.001.

