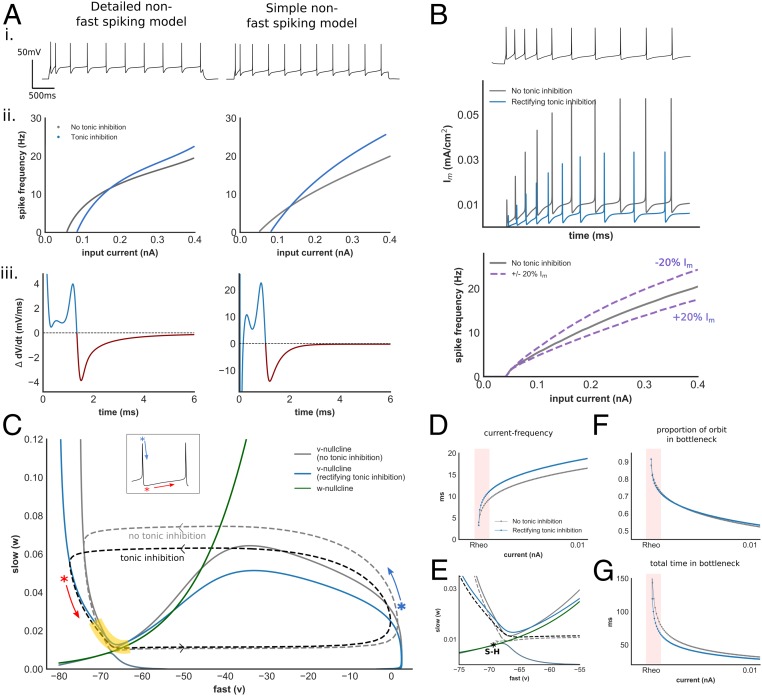
Fig. 6.
Modulation of AP dynamics with tonic inhibition within a simplified non–fast-spiking interneuron model. (A) Electrophysiologic features (i), I–F relationship (ii), and ∆ total membrane current (iii) within a simplified non–fast-spiking model and its detailed counterpart (simplified fast-spiking model in SI Appendix, Fig. S6A and parameter values in SI Appendix, Table S2). (B) Im current generated by the non–fast-spiking model without (gray) and with (blue) tonic inhibition, and impact of changes of Im current upon gain in this model (SI Appendix, Fig. S6B). (C) Phase-plane and orbits during AP generation of the v–w subsystem of the non–fast-spiking model, with and without tonic inhibition. Yellow denotes bottleneck region. Blue/red asterisks denote AP repolarization and AHP, respectively, corresponding to Inset time–voltage trace. (D) I–F relationship of the v–w system. Despite the absence of an ultraslow (Im) current, tonic inhibition increases gain. (E) Phase-plane of the v–w system at the bottleneck. Transition from rest to spiking occurs via saddle–homoclinic (S–H) bifurcation (SI Appendix, Fig. S6E). Tonic inhibition reduces activation of w and alters the trajectory through this region. Proportion of total orbit (F) and time (G) spent within bottleneck with increasing input. Despite a similar proportion of the orbit spent within the bottleneck, the presence of tonic inhibition produced faster current–frequency scaling (pink region). This is reflected in a change in the eigenvalue of the unstable manifold of the S–H bifurcation (0.027 and 0.04 without and with tonic inhibition, respectively).

