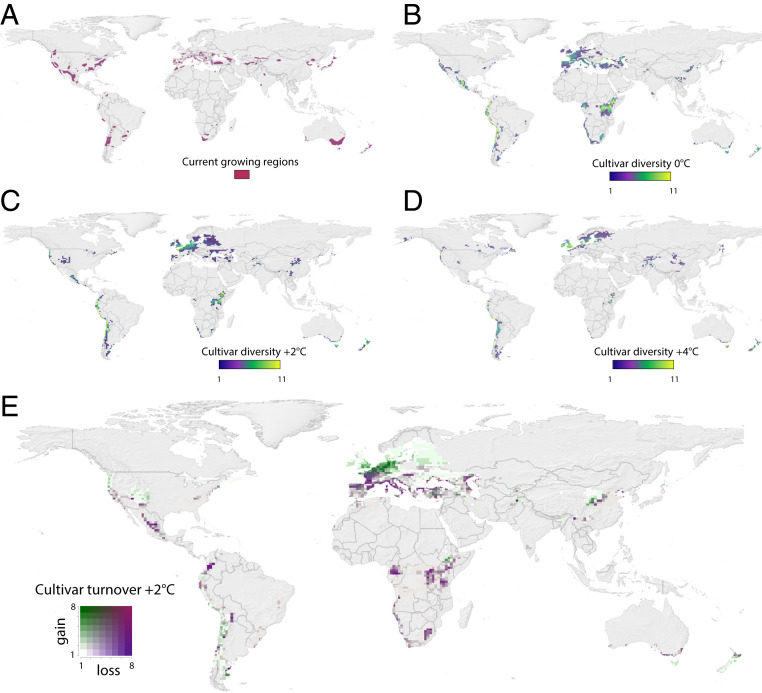
Fig. 1.
Global maps of winegrowing. (A) Current winegrowing regions (see SI Appendix, Fig. S1 for more detail). (B) Modeled predictions of cultivar diversity (total number of varieties) under our 0 °C reference scenario—all colored pixels show areas predicted as climatically suitable (Calculating Climatic Suitability). (C–E) Predicted effects of climate change on cultivar diversity and distribution under 2 °C warming (C), 4 °C warming (D), and cultivar turnover (E; cultivar gains and losses shown simultaneously via a bivariate color scale). See SI Appendix, Fig. S13 for 4 °C turnover.

