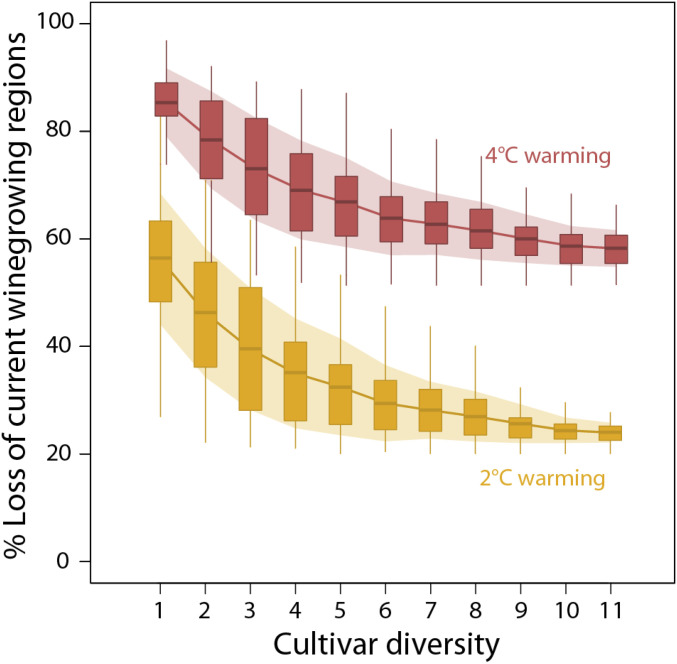
Fig. 2.
Winegrape cultivar diversity can impact the loss of current winegrowing regions (see SI Appendix, Fig. S14 for losses within all climatically suitable areas). Predictions of loss are shown for scenarios of 2 °C warming (yellow bars) and 4 °C warming (red bars) relative to a 0 °C reference scenario. Shaded areas illustrate SD around the mean loss for each number of cultivars, combining two sources of uncertainty: 1) variability according to all possible combinations of n cultivars (e.g., at one cultivar, that cultivar could be any of the 11 considered and each covers a different area), and 2) modeled climatic suitability under each climate change scenario (e.g., one model member may predict suitability of an area, while another does not). These results are based on climatic suitability calculated with all eight climate variables (Modeling Maturity).

