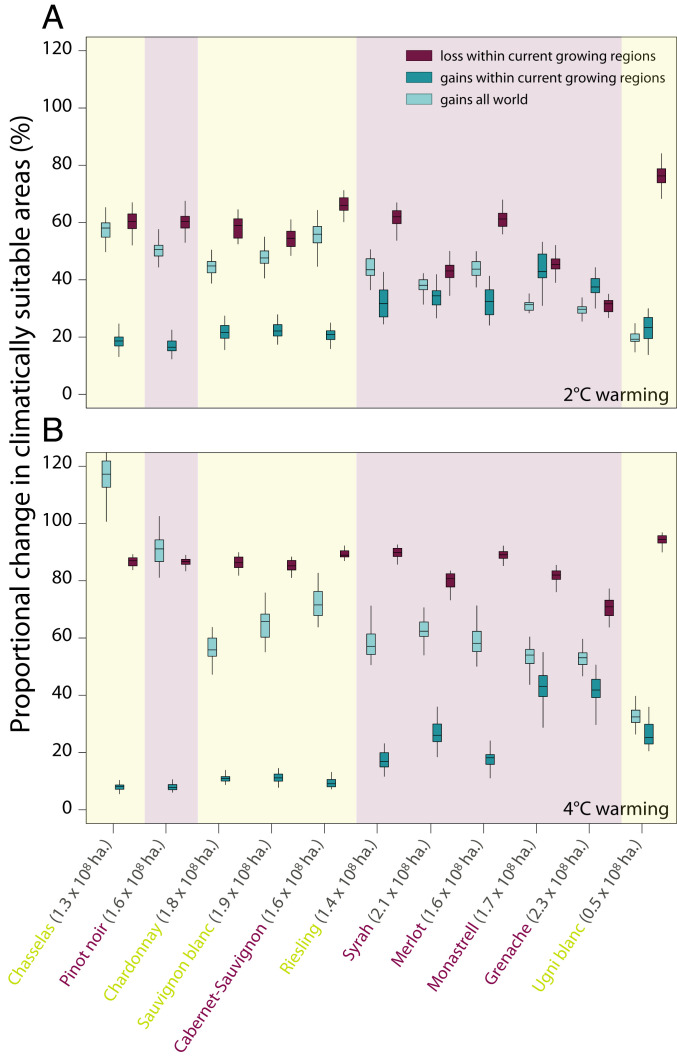
Fig. 3.
Predicted gains (turquoise) and losses (purple) of climatically suitable growing areas for each of the 11 studied winegrape varieties (cultivars) under scenarios of 2 °C (A) and 4 °C (B) warming. To facilitate comparison of varieties and warming scenarios, we show gains and losses as the proportional change for each variety with warming (i.e., the area predicted with warming relative to the area predicted under our reference scenario of 0 °C). Gains are shown relative to both current winegrowing regions (darker turquoise) and all areas identified as climatically suitable under our reference scenario (pale turquoise). Background shading and variety name coloring differentiates red from white varieties; for each variety, we also give the total hectares predicted to be climatically suitable under our reference scenario of 0 °C within current winegrowing regions parenthetically. For a version of this figure showing gains and losses as absolute change in hectares, see SI Appendix, Fig. S23.

