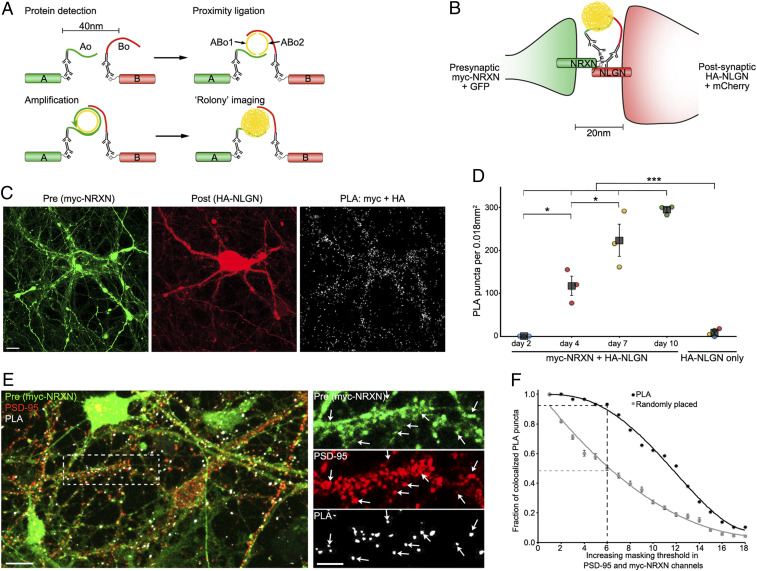
Fig. 1.
SYNPLA detects synapse formation and labels synapses. (A) Diagram of a general PLA reaction. Note that A and B must be sufficiently close to permit complementary binding and ligation of ABo1 and ABo2 and subsequent amplification to make a rolony. (B) Diagram of PLA targeting recombinant presynaptic myc-NRXN and postsynaptic HA-NLGN. (C) PLA rolonies (white dots, Right) formed between postsynaptic cultured mouse hippocampal neurons expressing HA-NLGN + mCherry (red; Middle) and cocultured presynaptic neurons expressing myc-NRXN + GFP (green; Left). (Scale bar, 10 μm.) (D) PLA puncta in each sample (circles) and average (squares) ± SEM for indicated expression and days in vitro (color indicates data acquired on the same day). ***P < 0.001, two-way ANOVA (see Methods); *P < 0.05, one-way ANOVA (with the Tukey–Kramer post hoc test). (E) PLA reaction between endogenous GluA1 and recombinant myc in cultured rat hippocampal neurons (exposed to cLTP; see Fig. 2) expressing myc-NRXN and cytosolic fluorescent protein (green), subsequently immunostained for endogenous PSD-95 (red). (Scale bars, 10 μm, Left; 5 μm, Right.) Arrows represent dendritic spines labeled by presynaptic myc-NRXN, PSD-95, and PLA puncta. (F) PLA puncta localize to synapses. In PSD-95 and myc-NRXN channels (from E, Right), pixels were set to zero (masked) for values below a progressively increasing threshold (x axis). Puncta (PLA or randomly placed) display colocalization if nonzero pixels exist within 0.14 μm in both thresholded channels. For the indicated threshold, ∼95% of PLA but only ∼50% of randomly placed (mean ± SEM of 30 placements) puncta colocalized with pre- and postsynaptic markers. See SI Appendix, Fig. S3 and Materials and Methods for details.

