Fig. 3.
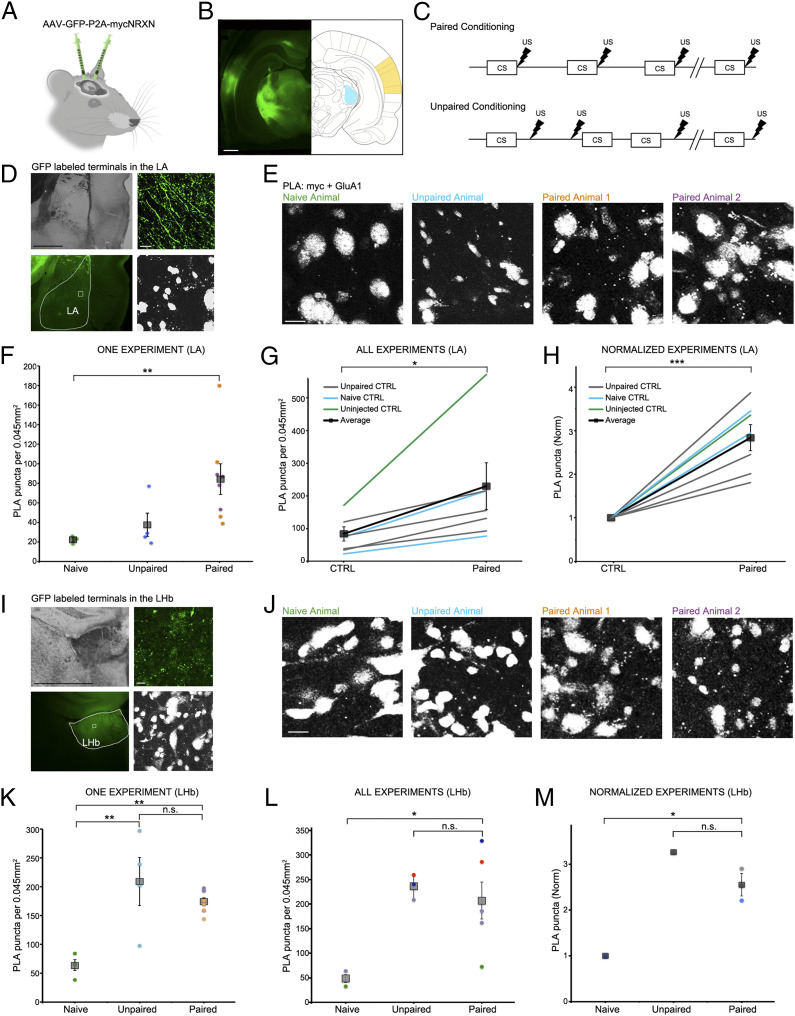
SYNPLA detects potentiated synapses between the medial geniculate nucleus or auditory cortex and the LA as well as the LHb following defense conditioning. (A) Injection of AAV9-GFP:P2A:myc-NRXN into the auditory cortex and/or medial geniculate nucleus. (B) GFP expression in the cell bodies at the injection sites (auditory cortex: yellow, medial geniculate nucleus: blue). (Scale bar, 1 mm.) (C) Diagrams of paired (Top) and unpaired (Bottom) defense conditioning paradigms; tone (CS; 10 s) and shock (thunderbolt) were delivered where indicated. (D) Representative images of presynaptic GFP-labeled fibers terminating onto the LA under low (Left; Top: transmitted light, Bottom: GFP signal, with LA traced in white) and high (Right; Top: GFP signal, Bottom: PLA) magnification in an animal that received paired conditioning. (Scale bar, Left, 1 mm; Right, 10 μm.) (E) Representative images of a single SYNPLA experiment in the LA from animals subjected to the indicated conditions; colors correspond to symbols in F. (Scale bar, 10 μm.) Note that nuclei show nonspecific staining after PLA in ex vivo slices; this signal is subtracted during image analysis (see Materials and Methods). (F) Quantification of the experiment shown in E. The number of SYNPLA puncta detected in one field of view (circles) and the average across all fields of view (squares) ± SEM are shown. **P < 0.01; one-way ANOVA with Tukey–Kramer post hoc test. (G) Quantification of all in vivo experiments, showing SYNPLA puncta per animal (average across all fields of view; gray) under the indicated control conditions and the average across animals (squares) ± SEM. *P < 0.05; paired t test. See SI Appendix, Fig. S6 for information regarding specific injection sites used in these experiments. SI Appendix, Fig. S7 shows similar results with data normalized to GFP-labeled fiber intensity. (H) Same data as in G, normalized to control. ***P < 0.001; paired t test. (I) Representative images of presynaptic GFP-labeled fibers terminating onto the LHb under low (Left; Top: transmitted light, Bottom: GFP signal, with LHb traced in white) and high (Right; Top: GFP signal, Bottom: PLA) magnification in an animal that received paired conditioning. (Scale bar, Left, 1 mm; Right, 10 μm.) (J) Representative images of one SYNPLA experiment in the LHb from animals subjected to the indicated conditions; colors correspond to symbols in K. (Scale bar, 10 μm.) (K) Quantification of the experiment shown in J. The number of SYNPLA puncta detected in each field of view (circles; four per animal) and the average across all fields of view (squares) ± SEM are shown. **P < 0.01; one-way ANOVA with Tukey–Kramer post hoc test; n.s., nonsignificant. (L) Quantification of in vivo experiments of all animals displaying green fibers in LHb (two naïve, three unpaired, and five paired animals), showing SYNPLA puncta per animal (average across all fields of view [four per animal]; each color represents distinct experiments) under the indicated conditions and the average across animals (gray squares) ± SEM. *P < 0.05; one-way ANOVA with Tukey–Kramer post hoc test. (M) Same data as in L for experiments with a naïve animal control, normalized. *P < 0.05; one-way ANOVA with Tukey–Kramer post hoc test.

