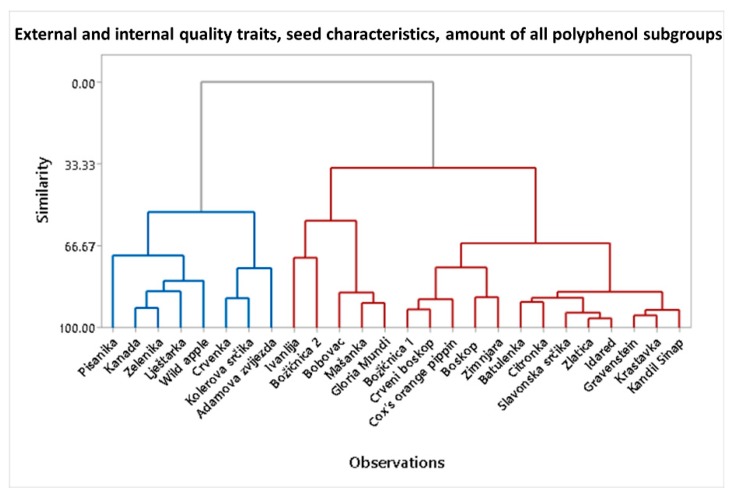
Figure 4.
Dendogram of all fruit internal and external quality parameters, all seed parameters, and the amounts of all polyphenol subgroups in flesh and peel. It shows the clustering of apple varieties into two clusters (the group colored blue corresponds to higher polyphenol content and the group colored red corresponds to lower polyphenol content).

