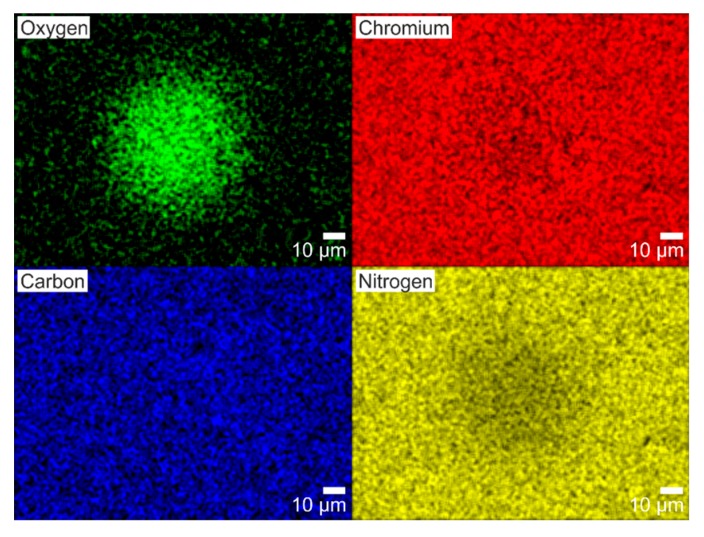
Figure 6.
EDX analysis of the fs-laser irradiated spot shown in Figure 5A, where the concentrations of oxygen, chromium, carbon and nitrogen are displayed in false colors. Brighter colors indicate larger signals. Note that the spatial distribution of oxygen is consistent with the irradiated spot shown in Figure 5A.

