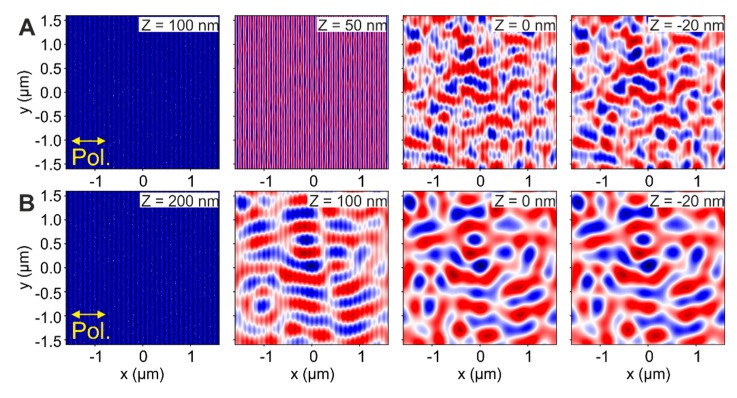
Figure 9.
FDTD-intensity distribution at different Z-positions along the beam axis for two different layered systems with HSFL modulation depth dHSFL = 50 nm and. In (A) the oxide layer thickness is Tox = 100 nm and in (B) Tox = 200 nm. The interface between the oxide layer and the CrN is located at Z = 0 nm. The plots at Z = −20 nm in both cases correspond to intensities calculated 20 nm inside the CrN from the oxide-nitride interface. The laser beam (λ = 800 nm) polarization direction is horizontal. The colors of the intensity plots are encoded in a false color scheme where red indicated deviations above and blue below the average intensity value of the image, represented in white.

