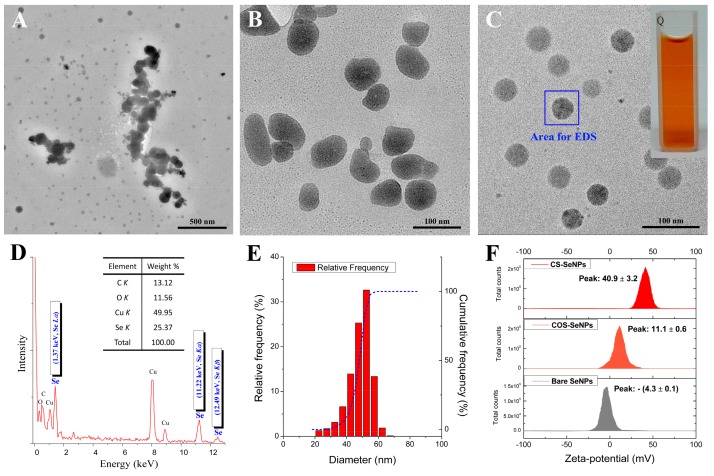
Figure 1.
Typical morphology and formation of selenium nanoparticles (SeNPs). TEM images of (A) bare SeNPs, (B) chitooligosaccharide (COS)-SeNPs, and (C) chitosan (CS)-SeNPs. (D) EDS spectra of CS-SeNPs determined from the area shown in Figure 1C. (E) The size distribution of CS-SeNPs measured from the TEM results. (F) Zeta-potentials of bare SeNPs, COS-SeNPs, and CS-SeNPs, measured at a pH of 5.0 ± 0.3.

