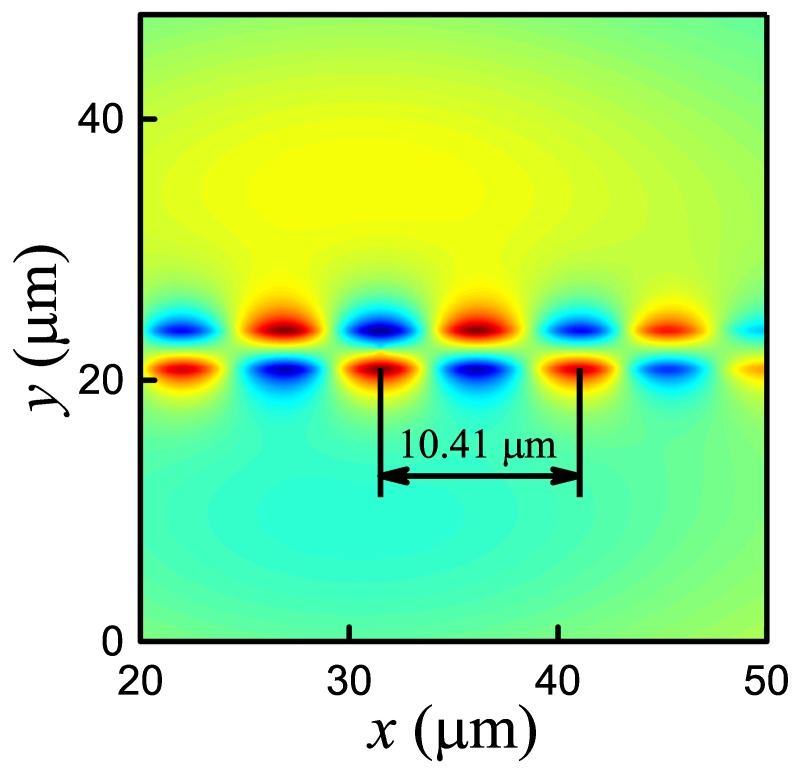
Figure 6.
The spatial distribution of field component for SPP generated on a pair of graphene sheets. The FDTD method is our own implementation in MATLAB. The parameters correspond to those in [22]. Taking into account new values of conductivities [22]: and (slight differences from Hossain and Rana [22] are associated with calculation accuracy). The calculated value .

