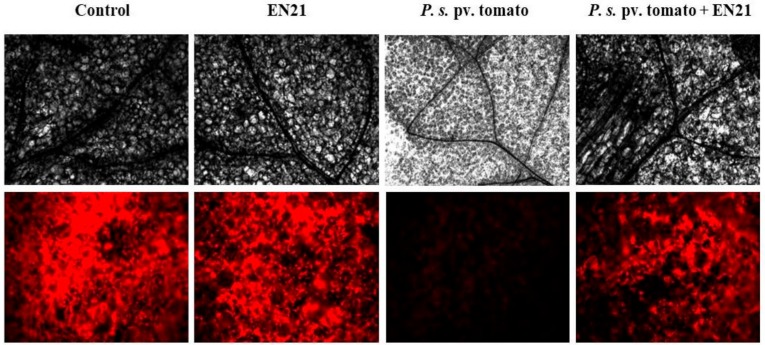
Figure 3.
Visualization of tissue structure and chlorophyll content in Arabidopsis leaves by differential interference contrast (DIC) and epifluorescence microscopy 100× (first and second row, respectively). Leaves were inoculated with sterile water (control), EN21 and phytopathogen mono-cultures and phytopathogen-EN21 co-culture (from left to right in panel). Micrographs from each row were taken under the same exposure time, gamma and gain values for comparative analysis. Epifluorescence images were digitally coloured.

