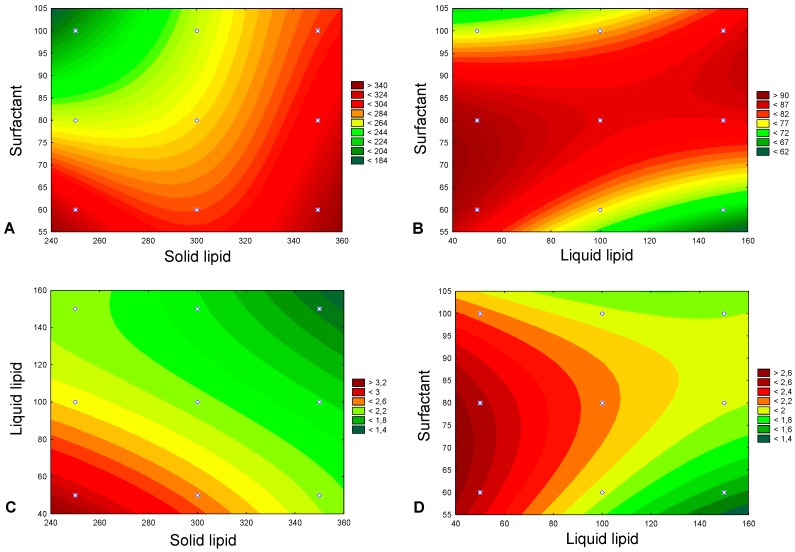
Figure 1.
Response contour plots, representing the statistically significant effects (p-value < 0.05), namely (A) the effect of the amount of solid lipid (X1) and amount of surfactant (X3) on particle size (Y1), (B) the effect of the amount of liquid lipid (X2) and amount of surfactant (X3) on encapsulation efficiency (Y2), (C) the effect of the amount of solid lipid (X1) and amount of liquid lipid (X2) on loading capacity (Y3), and (D) the effect of the amount of liquid lipid (X2) and amount of surfactant (X3) on loading capacity (Y3).

