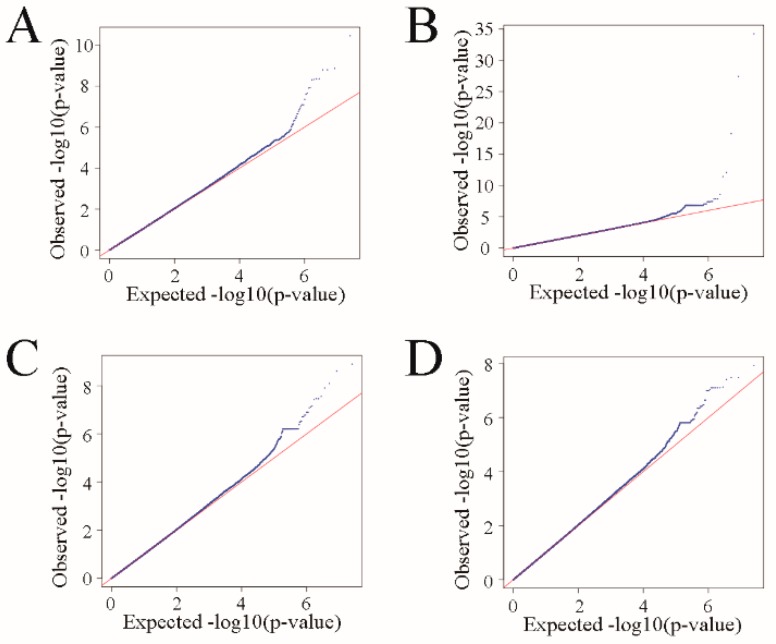
Figure 2.
Quantile-quantile plots of body weight traits using mixed linear model approach. Blue dots represent the −log10 (p-value) of the entire study and the red line represents the expected values under the null hypothesis of no association. (A) birth weight; (B) weaning weight; (C) yearling weight; (D) adult weight.

