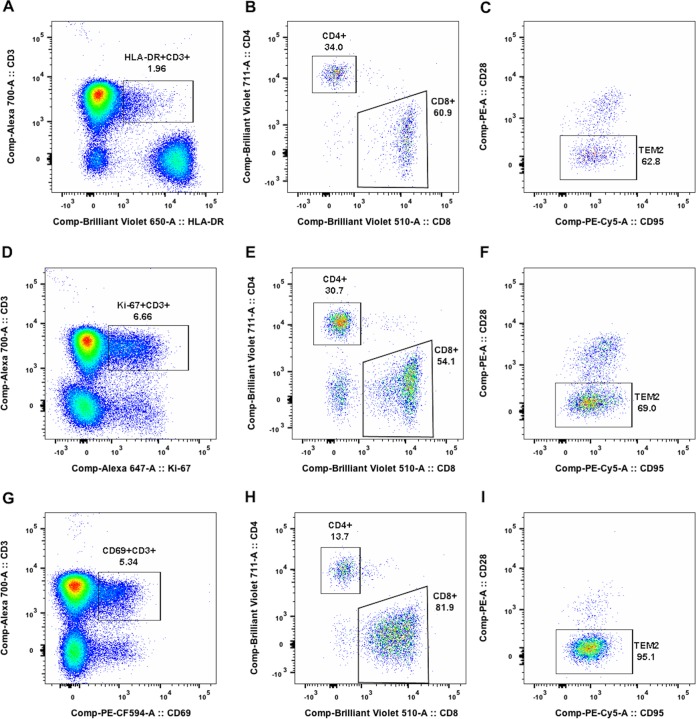
FIG 3.
Quantification of activated or proliferating T cells using HLA-DR, CD69 and Ki-67 markers. Panels A to I display the data of animal C2 on day 28 postchallenge. (A, D, and G) Expression of HLA-DR, Ki-67 and CD69 by CD3+ T cells within the CD45+ lymphocyte gate. (B, E, and H) Frequencies of CD4+ and CD8+ T cells within the HLA-DR+ CD3+, Ki-67+ CD3+, and CD69+ CD3+ gates, respectively. (C, F, and I) Frequencies of TEM2 (CD95+ CD28−) cells within the CD8-positive T cell populations.

