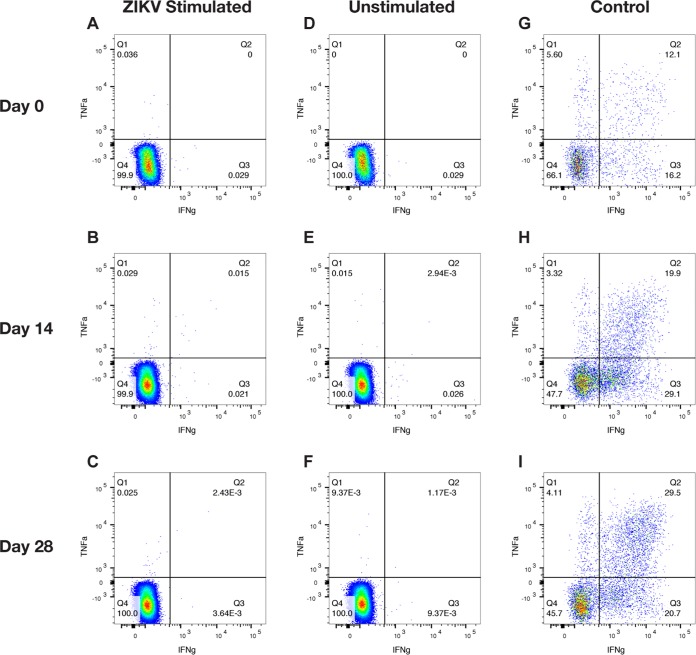
FIG 4.
Intracellular cytokine staining for CD8 T cells of ZIKV-rechallenged animals. Representative flow plots for animal C1 on days 0, 14, and 28 after rechallenge show the production of IFN-γ and TNF-α as measures of cellular activation. (A to C) Data for activated CD8 T cells following whole ZIKV stimulation. (D to F) Numbers of activated CD8 T cells when unstimulated. (G to I) Numbers of activated CD8 T cells when stimulated with a leukocyte activation cocktail as a positive control.

