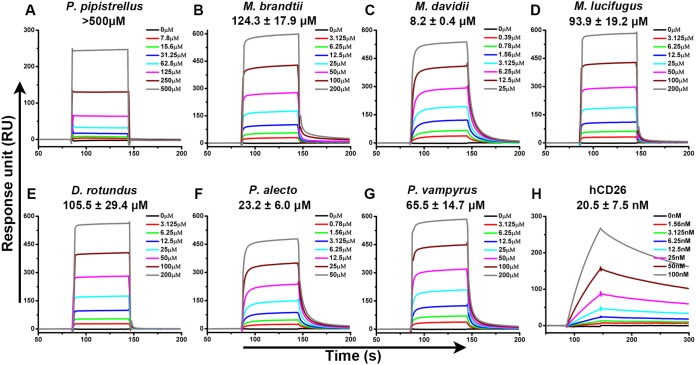
FIG 2.
Specific interaction between MERS-RBD and different bCD26s characterized by SPR. MERS-RBD was immobilized on the chip and tested for binding to various concentrations of the indicated bCD26s or hCD26. The binding profiles are shown. (A) P. pipistrellus bCD26 binding to MERS-RBD. (B) M. brandtii bCD26 binding to MERS-RBD. (C) M. davidii bCD26 binding to MERS-RBD. (D) M. lucifugus bCD26 binding to MERS-RBD. (E) D. rotundus bCD26 binding to MERS-RBD. (F) P. alecto bCD26 binding to MERS-RBD. (G) P. vampyrus bCD26 binding to MERS-RBD. (H) hCD26 binding to MERS-RBD. In each subplot, the concentration of the indicated CD26 used for binding evaluation is listed in the inserted box. The KD were calculated using BIAevaluation software 4.1 and the values are displayed in each subplot. KD values are shown as means ± the standard errors of the mean (SEM) of three independent experiments. The curves are representative of three independent experiments and were generated using Origin8 software.

