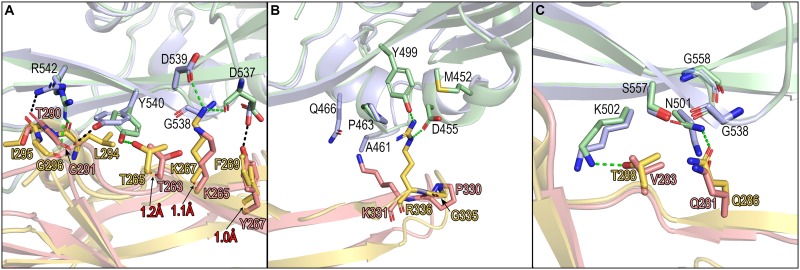
FIG 5.
Comparison of the MERS-RBD/hCD26 and MERS-RBD/M. davidii bCD26 pairs for their interaction details. The variations in the MERS-RBD binding interface of M. davidii bCD26 and hCD26 are delineated in panels A to C. MERS-RBD complexed with M. davidii bCD26 is colored in light blue. MERS-RBD complexed with hCD26 is colored in pale green. M. davidii bCD26 is marked in salmon, and hCD26 is marked in yellow-orange. The potential H-bonds between M. davidii bCD26 and MERS-RBD are indicated by black dashed lines. The potential H-bonds between hCD26 and MERS-RBD are indicated by green dashed lines. The red numbers represent the shifted distances of the indicated elements in M. davidii bCD26 compared to hCD26. The structures were analyzed and depicted by PyMOL.

