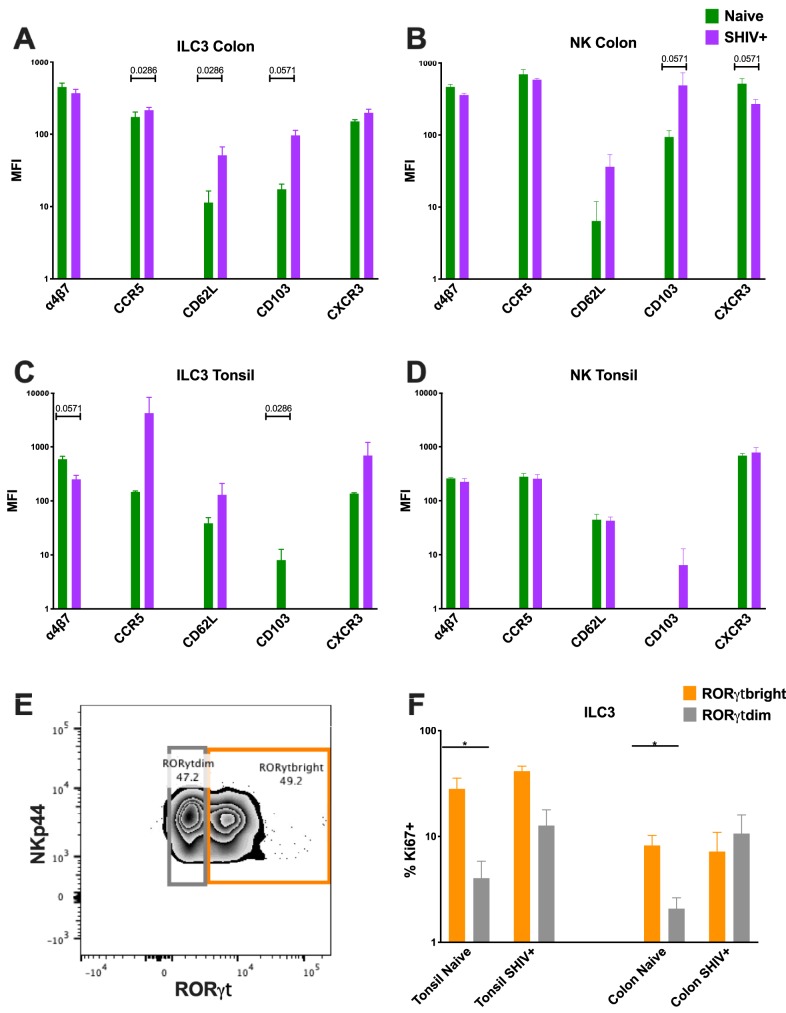
FIG 4.
(A to D) Mean fluorescence intensity (MFI) plots of ILC3 (A and C) and NK (B and D) cells in colon (A and B) and tonsil (C and D) tissue expressing trafficking, proliferating, and chemokine receptors compared between naive and acutely SHIV-infected RM. Samples are from naive infant RM (n = 4) and from those with SHIV infection (n = 4). (E) Representative flow cytometry plot delineating RORγdim versus RORγtbright within the ILC3 population. (F) Percentages of Ki67-expressing ILC3 with bright versus dim RORγt expression. The Mann Whitney U test was used to compare different quadrant populations. *, P < 0.05; **, P < 0.01; ***, P < 0.005.

